

In the world of classic business intelligence, it’s not an understatement to say the query is king. Given the technology and infrastructure constraints businesses have faced in previous years, business leaders needed to know the exact question they wanted answered, and then direct BI analysts to build complex queries in order to explore all the relevant data and find meaningful insights.
The problem with this model? It takes a long time, even for the fastest business intelligence platforms, to find insights. Even more challenging, businesses missed out on critical insights because they simply didn’t ask the right question. It’s simply impossible for a human to think and ask every possible question they can of data. It’s no shock, then, that adoption of BI has hovered around an abysmal 21%.
At ThoughtSpot, we knew we needed to look to new technologies and techniques if we wanted to solve this systemic challenge in analytics and help businesses find the most meaningful, impactful insights even when they don’t know the question to ask. That’s why we built SpotIQ, our AI analytics engine. By combining our lightning fast BI platform and AI, machine learning, and statistical techniques, SpotIQ does the work of 1000 data analysts, answering thousands of questions users didn’t even know to ask and finding insights buried in the mountains of data today’s businesses gather.
Bringing AI to BI
While building SpotIQ, we wanted to start with analytics features that could drive the most impact for BI professionals and the business users. We began with anomaly detection, trend detection and cross-correlation.
Anomaly or outlier detection enables users to find the ‘unexpected’ insights hidden in data. SpotIQ computes z-scores and linear regression model to find high and low outliers in a data set. The z-score method can be further customized with settings for min standard deviation, adaptively reducing the min std-dev if no outlier detected, min number of data points etc.
Trend detection gives users the ability to understand where the business is going, where it’s trending up or down, and inform planning. SpotIQ leverages the linear regression algorithm to detect trends, which can be further customized by specifying the minimum gradient/slope and the max p-value.
Cross-correlation helps get to the ‘why’ behind an insight by detecting other factors influencing a specific metric. These algorithms can be customized by specifying the minimum correlation coefficient and the max lag.
Going Under the Hood: SpotIQ’s Analysis Methodology
So how exactly does SpotIQ use these capabilities to analyse data? For a given query and its resultset data, the analysis is first performed by drilling on the query attributes and measures. For example, for “Revenue by State” - the drill attribute would be “State” and the measure would be “Revenue”. Any states with very high or very low revenue relative to the mean/median - would be flagged as outliers.
After selecting your first attribute, up to 10 additional attributes are added, one at a time, for deeper drill down. These attributes are obtained from the involved data tables and ordered by ranking algorithm based on factors such as contextual usage, static ranking, and overall usage.
For example, for the State “California” and the drill attribute “Order Date (quarterly)” - any quarters with very high or very low “Revenue” in the CA state are flagged as outliers. This comprehensive analysis explores ~50 states with ~10 drill attributes - performing the outlier detection on ~500 data sets.
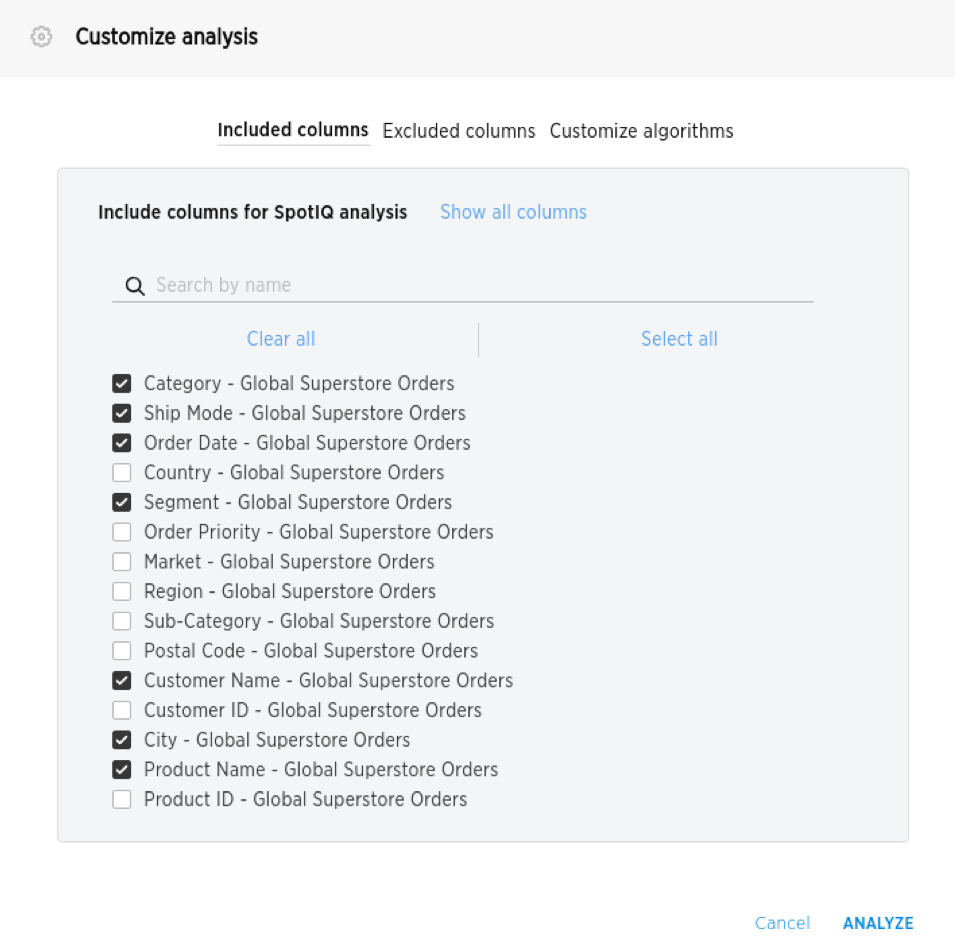
The process of drill column selection
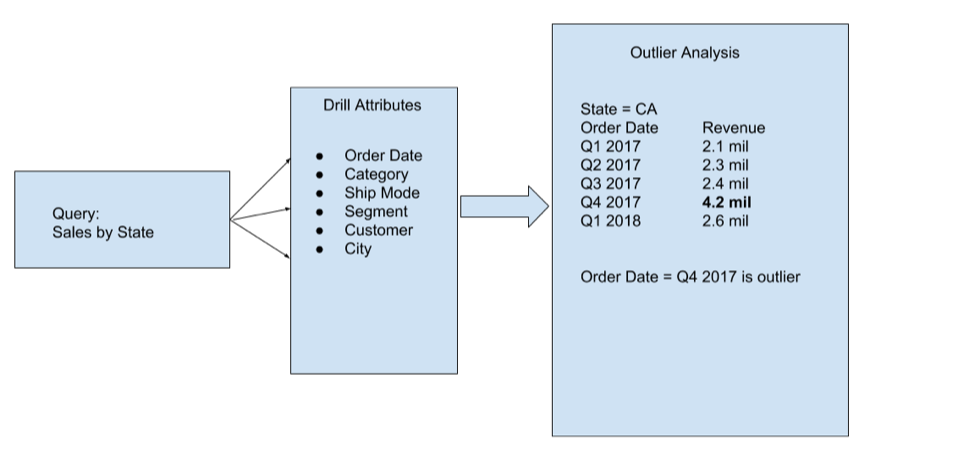
Outlier Analysis for the query “Sales by State”
Then for each of the datasets, any steady up or down trend is detected using linear regression.
Finally, other measures such as “Profit”, “Marketing Budget” etc are used to find correlation with Revenue - e.g. “Marketing Budget” is correlated with “Revenue” with a lag of 3 weeks and confidence percentage 85%.
The extent and magnitude of comprehensive analysis described above is what we like to call “bringing the power of 10,000 analysts to your fingertips”.
Even though the comprehensive analysis can result in thousands of insights, only the top ranked insights are shown to the user for each of the analysis types.
An example outlier insight, showcasing the power of deeper drill by values and columns.
Customizing Analysis in ThoughtSpot
The user can customize the algorithm in several ways:
Override the drill columns (attributes and measures) - specifically include some or exclude some of them.
Exclude certain data values, e.g. null attribute and zero measure values.
Specify maximum insight counts for each of the analysis types: anomaly, trend and cross-correlation - to emphasize or de-emphasize certain kinds of analysis.
Override default algorithm parameters - e.g. the z-score threshold, the minimum rows used for a drill, the min slope of a trend, the max p-value, etc.
Such customizations can greatly increase the analysis capabilities of slightly advanced users.
Leveraging R for Advanced Analysis But what if you want to go beyond the standard analysis algorithms? Luckily, SpotIQ has an option to specify custom R scripts to analyze the underlying chart data. The user gets assistance in mapping the data columns with the R script variables and siphoning out PNG image or CSV data from the R service. All this can be done in the browser, without installing any R software.
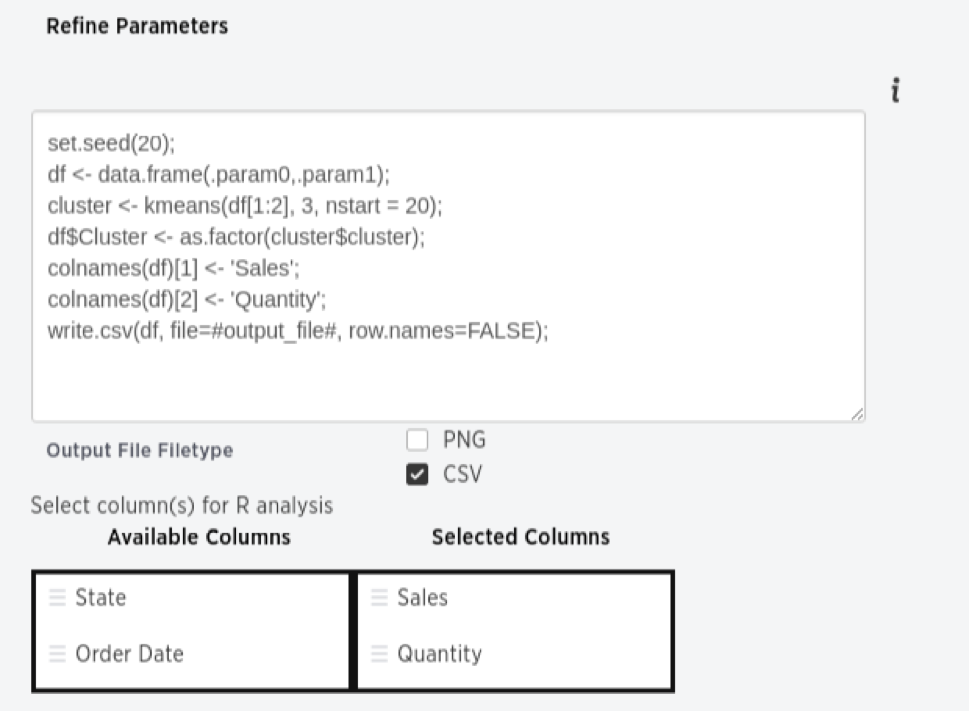
R-script for 2D k-means clustering - mapping data columns to R variables.
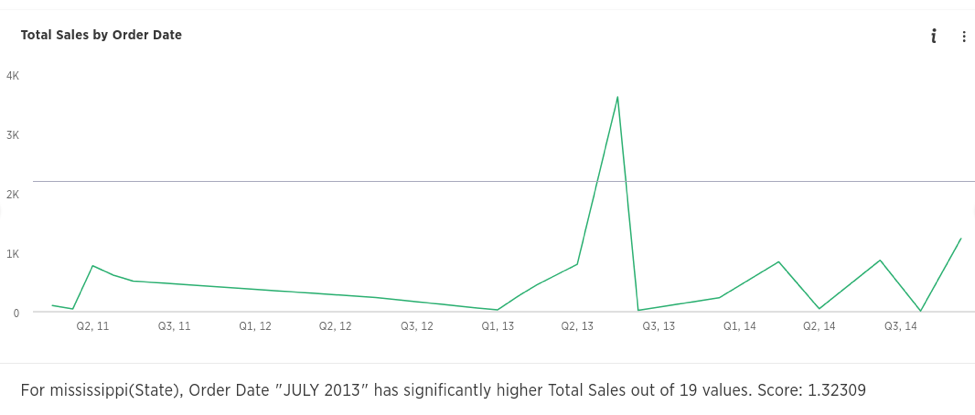
Contextual Insights
Based on the context of the user, e.g. viewing a specific data chart, a variety of quickly computed insights extracted from the underlying data are instantly presented to the users with an option for comprehensive analysis. This is critical to bridge the gap between advanced users who perform deep analysis on a regular basis, and the casual users who typically perform more basic ad hoc searches.
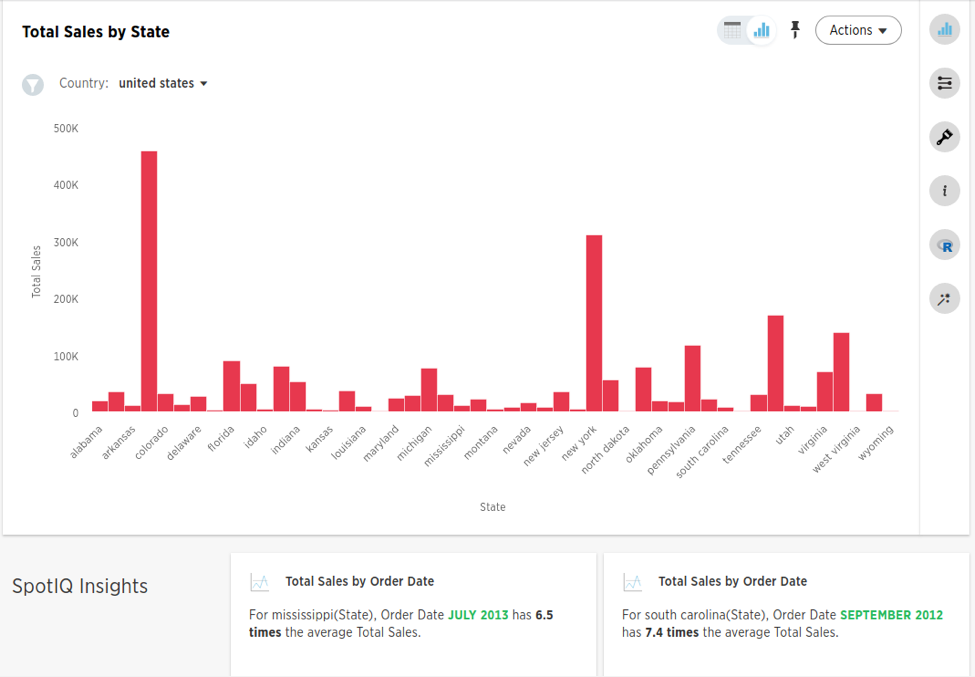
Instant Insight on the context of a chart. Query: Sales by State, Drill attribute: “Order Date”.
It’s incredible to see the power of artificial intelligence in business intelligence. With SpotIQ, this AI analytics enables users to find insights that would have otherwise gone unnoticed, drill even deeper into data, and turn analytics into a cornerstone of decision making throughout an organization.
If you’re curious and want to learn more, sign up for a 1:1 demo today!


