


There are millions of data products out there, some successful and others…less so. But the truly standout data products are the ones that change users’ behavior. You know you’ve built something special when your users start forming habits around your product.
The question is, how do you create something that stands out in a sea of data products? We believe it comes down to one thing: a relentless focus on delivering user value. But before we get ahead of ourselves, let’s make sure we’re all on the same page about what a data product is.
Data product vs data as a product
Popular in the data mesh world, “data as a product” is sometimes abbreviated to “data product”. However, the two terms have very distinct differences.
A data product is a broad definition that includes any product or feature that utilizes data to facilitate a goal. For instance, the app on your smartwatch is considered a data product because it uses data to engage you and inform you of key health metrics you have an interest in following.
On the other hand, the phrase data as a product refers to a way of thinking about your company’s data. This is the theory of applying a product mindset to your datasets — treating them as assets —and ensuring your data has desirable qualities like security, governance, and trustworthiness.
For the sake of this article, I’ll focus on data products in their true form. However, if you’re interested to learn more about treating data as a product, I encourage you to check out Episode 54 of The Data Chief podcast where CDO, Pascale Hutz, shares first-hand accounts on American Express’s journey with treating data as a product. Now that we’ve defined a data product, let’s take a closer look at how you can build a great one.
Step 1: Identify the problem and define the objective
Too many product managers fall into the trap of thinking, “If we build it, they will come.” That’s rarely true and more often than not, a recipe for failure. Before your team even writes a single line of code, you’ve got to start by validating your product idea first.
1. Conceptualize the idea
What’s the market like for your data product; does it even exist? To test out your product assumptions, you need to get incredibly clear on your unique value propositions.
Here are some questions to jump start that process:
What value will the user get from using this product?
Why would a user want it?
What will a user accomplish with it?
What core features are required for users to achieve their goals?
What’s the killer feature that’s going to be a game-changer for the user?
Do I want to target a certain group of users with a specific solution (niche but potentially higher conversions and stickiness) or create a product with a broader potential market (larger pool of potential customers but vulnerable to competitors)?
How much will it cost and how long will it take to turn this idea into a minimum viable product (MVP)?
How will I monetize the product?
It’s also useful to test your product against what we call “user story” statements that summarize user intent. Start with a statement in the following format:
“I’m a [type of user], and I want to [do something with the product or feature] so that I can [get a specific benefit].”
Does your data product actually help your user accomplish their goal? Is it easy to obtain? If the answer is yes, you're on the right track. Now repeat the process with different user stories, and challenge yourself to get more specific with each iteration.
2. Conduct market research
As you start planning, take a look at the market and see how your data product could potentially add value. Here are a few ways to begin familiarizing yourself with your market:
Spend time in communities and forums related to your data product. Depending on your specific buyer persona, you could try browsing Reddit, Twitter, Substack, Quora, or LinkedIn. Look at what people are talking about in your data product category. What questions get asked the most? What do people desire? What do they complain about?
Size up the competition. Try to identify who your top competitors are, what they’re doing right, where they could improve, and how you would position your data product accordingly.
Look for relevant meet-ups and hackathons you can attend. Pay attention to what ideas are getting thrown around, what prototypes are being built, and what your users could be struggling with.
Ask for feedback on the data product idea with surveys. Send a survey out via your email list or conduct a poll on digital channels. Try asking questions like, “What do you like the most about this idea?” or “How would you use this data product?”
Explore the latest search trends within your data product category. Do any of the trends present a threat or an opportunity to the data product idea you’re working on?
3. Gather user data
If you’re working on leveling up an existing data product, you’re in the lucky position of having existing user data. If you’re creating a new product, then this is where your beta testers come in handy. Your users’ behavior will tell you everything you need to know about how to take your app to the next level. To gather the necessary information you need, try:
Reviewing customer support data to see what questions, problems, and pain points keep coming up
Reviewing user requests to see what people ask for the most
Tracking in-app behavior with software solutions like Mixpanel (or many others) to observe the user journey within the app
Start Getting Better Insights
Step 2: Decide on the architecture and framework for your new data product
Now that you’ve identified what problem you’re solving, what’s most important for the users, and how you’ll solve the problem, it’s just a question of selecting or creating the data you need to solve that problem.
Let’s imagine that you’re looking to break into the online share trading market, for instance. Through your research, you’ve realized that a lot of your potential users are new to online trading, unsure of which shares to invest in, and they aren’t sure how to get the most value from your in-app trading experience. As a killer feature, it would be great if your users could see what the top 10% of traders on your app are doing, right? That way, your newbie users could mirror the top performers’ holdings and trades; making more money from the app and spending more time there. Also, how much would your users pay to get access to that?
Based on user experience research on performance goals, you could decide that trade analysis and transactions should take place in under two seconds, or you would see a large number of users drop off of your app, exiting this interaction altogether. So, you’d also want to ensure this feature would work very quickly.
Now that you’ve identified two core items in a user journey and figured out how you want to solve it, you can work backward to figure out the data infrastructure you need:
In order to build this feature, you need specific usage data of your top traders. You also need to anonymize, aggregate, and store that data so that it is governed and accessible.
Then, you know you need an analytics tool that can produce a data visualization to show the overall performance of the top 10% of traders, and allow users to analyze and explore that performance.
So, now you know what data you need—which of your users are in the top 10%, what holdings they have, and how to track their trades. At this point, you have what you need to work out your database schemas, tables, dimensions, and metrics from a data perspective.
You also need to think about the scale of the data because that will dictate the best structures to handle it. Will you need to process a million records? 5 million? 50 million?
Because of your earlier performance goals of having this app process any transaction in two seconds, you might also want to choose a cloud data warehouse that can process information at speed and scale.
By figuring out your main priorities and how the product will add value for your users, you can make better decisions about the data architecture that will serve you well in the long term.
Finally, based on available resources, you might need to decide which aspects you should build and which you should buy to meet deadlines. For instance, Loan Market Group decided buying an embedded analytics solution would be much quicker and more cost-effective than building it themselves.
Data product example: Loan Market Group’s MyCRM
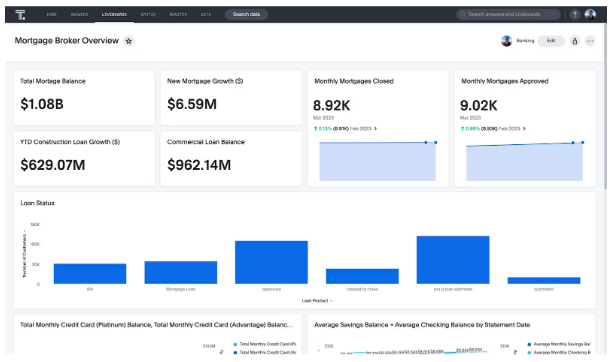
Loan Market Group, Australasia’s biggest aggregator, decided they needed to level up the user experience for MyCRM, their flagship data product for brokers, because their current reporting tools were too inflexible to handle the wide variety of questions that arose. After doing research in the planning stage, they realized that buying an embedded analytics solution would be faster and more comprehensive than building one. So, they set up ThoughtSpot Embedded and users were immediately hooked.
“The slick search-based interface makes it simple for our brokers to answer questions themselves in addition to the prepackaged Liveboards we are shipping with MyCRM. We knew we had found the key to dramatically accelerating our time to market for a seriously sticky and interactive version of the product.”
- Santiago Murisengo, Senior Product Manager at Loan Market Group
Loan Market Group developed and launched a new version of MyCRM with ThoughtSpot Embedded in just three months. Today, they’re looking at a projected increase of 14x more monthly active users (MAU) engaging with MyCRM.
Step 3: Design the data product
Now for the fun part — designing and building the product. Your top priority here has to be the user experience. Start by designing the user flow and the user interface for each stage. At ThoughtSpot, we usually use Figma to map out the end-to-end user interface, so everyone understands what the user will see at each stage. When they click on something, where does it go? What’s the experience for that user? What actions can they take at each screen?
Personally, I don’t think anyone’s said it better than Marissa Mayer, back when she was CEO of Yahoo! She followed three principles of app design which I think still apply to this day:
1. The Two-Tap Rule
Users should be able to do the main things they’d want to do in the app with a maximum of two taps.
2. The Five-Point Rule
Every new font, font size, or color on a page counts for one point. If your page contains more than five points, it’s probably time to redesign.
3. The 98% Rule
Every product should be designed for how it will be used 98% of the time. As Marissa Mayer will often point out: take a Xerox photocopier. You can do all kinds of things with a copier, but 98% of the time, you want to use it to make a photocopy. So, it’s designed to make that as easy as possible—you just put your paper on the glass and hit the big green button. Every app needs the equivalent of that big green button.
When it comes to great product design, I like to say that once you’ve got the sausage, it’s time to bring the sizzle. Your branding, your design language, your composition—that all needs to be in your data product. That’s why ThoughtSpot Embedded lets our customers easily customize embedded analytics to fit their own unique brands—to truly make it theirs.
Read more: Insider’s guide to improving customer experiences with embedded analytics
Step 4: Launch your data product
Don’t fall into the trap of thinking that great data products sell themselves. Standout products need a standout launch—meaning a solid plan and careful monitoring as you execute the plan.
When should you launch?
I know it sounds crazy, but before you feel ready! Launch your data product once you have a minimum viable product (MVP) that’s 90% of the way there. There are three reasons for that:
You’ll never really feel “ready to launch.” Launching a new product into the world is inherently uncomfortable and risky.
You need to get your product out before the competition to gain the first-mover advantage. Done is better than perfect.
You need to leverage the momentum you’ve built with your existing or prospective users. Generate some excitement and incentivize your first cohort of users with a discount or exclusive access to new features. Then, launch while they’re still excited to see what you’ve been working on.
So, the name of the game is to launch early and iterate quickly. Plan to release a v1.1 promptly to address the issues you already know about, as well as the bugs or requirements you didn’t expect from usage monitoring and user feedback.
What metrics should you track at launch?
If you want to build a standout product, you need to pay close attention to user data and iterate quickly. You want to focus on the four pillars of successful data products:
User engagement: Are people using the data product?
User satisfaction: Are they happy and do they keep returning?
User acquisition: Are you gaining new users quickly enough?
Performance: Is your data product working as expected?
Avoid metrics overload — start with these essentials first:
Daily and monthly active users
Stickiness
Retention rate
Churn rate
Average revenue per user
User lifetime value
Feature usage
Dig deeper: 11 Metrics and KPIs the most successful product managers track
Step 5: Iterate the data product
Unless you’re lucky, you probably won’t build the ideal data product right out of the gate. You need to gather user data and feedback to continuously refine and improve your product over time. Here’s how to do that:
Go back to your market research
Revisit the market research you did in Step 1. This time, in addition to reviewing trends or conducting surveys, you can look for specific insights about your product. If you're making a dent in the market, what are people saying about your products? What are they commenting on? How are they framing your product? What value are they getting out of it?
Build feedback into your product design
Feedback is powerful—so you need to make it easy for people to share their input with you. Build feedback tools right into your data products. For example, we recently launched a free Google Sheets plugin for ThoughtSpot. It lets you perform searches and analytics on Google Sheet data with no expertise, and users can leave feedback within the app store.
Prioritize issues based on user value
You might feel like you have to fix every issue immediately, but that isn’t practical. Instead, prioritize your changes based on what your users think is important. Before adding a bug fix to your v1.1 plan, ask yourself: “Will fixing this issue impact the four pillars that matter? Will it move the needle for active users? Will it increase the lifetime value for each user?” Attaching a monetary value to each task on your to-do list will help ensure you’ve got your priorities right. Typically, your v1.1 should improve performance and iron out bugs instead of trying to cram in new features.
Reviewing your product priorities and user feedback must be built into both your product development plan and your user engagement strategy. If you fail to keep an eye on the market, the competition, and your changing user requirements as they evolve, your standout data product will swiftly become obsolete. I’m certain we can all think of great apps we’ve used a few years ago that have lost their luster (Remember Vine, anyone? How about Clubhouse?). Maybe they were before their time, or maybe they were not invested in continuous product development.
More often than not, the latter is the case. Creating a pioneering product will only take you so far. Constant maintenance and investment in the user feedback cycle is key to keeping your product fresh and relevant.
Build better data products with ThoughtSpot Embedded
ThoughtSpot Embedded empowers product builders to create engaging, interactive experiences that get to market much faster than a home-grown feature set. You can use ThoughtSpot Embedded to embed AI-Powered Analytics in your data products to give your users a live, intuitive natural language search experience combined with AI and free-form data exploration. Plus, you get done-for-you analytics services, robust APIs, and interactive developer resources your team will love.
See for yourself—go ahead and explore ThoughtSpot Embedded right now. Or, if you’re curious about implementing ThoughtSpot Embedded in your data products, you can start a free trial today.


