


Product teams have a lot of responsibilities, from developing product strategy to increasing user engagement with embedded analytics to working with cross-functional teams to ensure that products are delivered on time and within budget. With so much on their plate, it's easy to see why some product managers neglect to track metrics and KPIs.
However, tracking metrics and KPIs is crucial to the success of any product team. By tracking metrics, product managers can identify areas that need improvement and develop data-driven decision making that help improve the overall performance of their products.
There are a variety of metrics and KPIs that you can track, but here are the metrics that the most successful product teams use.
1. Daily and monthly active users
Daily and monthly active users (DAU and MAU) are two metrics that are often used to measure the success of a product or service. DAU measures the number of unique users who use a product or service on a given day, while MAU measures the number of unique users who use a product or service in a given month. Both metrics can be helpful in assessing the health of a product or service and determining whether or not users are finding value in what is being offered. Additionally, DAU and MAU can be useful for comparing the performance of different products or services.
There are a few things to keep in mind when interpreting DAU and MAU. First, it is important to consider the overall size of the user base. If there are only a few thousand users, it is likely that the DAU and MAU will be lower than if there are millions of users. Additionally, it is important to consider the nature of the product or service. For example, a social media platform is likely to have a higher DAU than a productivity application because users are more likely to check social media multiple times per day. Finally, it is important to keep in mind that DAU and MAU are just two metrics and should not be used as the sole basis for making decisions about a product or service.
2. User Engagement
User engagement is the level of interaction and involvement that a user has with a product, service, or brand.
User engagement can be measured in a number of ways using product analytics like Heap or Mixpanel. These tools can show the frequency of use, time spent using, pages per session, bounce rate, number of sessions, and satisfaction levels.
User engagement is important because it is an indicator of how well a product or service is meeting the needs of its users. High levels of engagement can lead to increased customer loyalty and brand advocacy, while low levels of engagement may indicate that a product or service is not meeting user needs and could result in churn. Understanding how to measure and increase user engagement is critical for businesses looking to improve their bottom line.
Start Getting Better Insights
3. Activation rate
Activation rate is a metric that measures the percentage of customers who successfully activate a product. This metric is important because it allows businesses to track customer engagement and ensure that customers are using the product as intended. There are a few different ways to measure product activation rate, but the most common is to track the number of unique users who successfully activate the product within a certain time period. Businesses can use this metric to track customer engagement and ensure that customers are able to start using the product as intended. By tracking the product activation rate, businesses can identify issues with the product or customer experience and make necessary changes to improve the product.
4. Churn rate
Churn rate is a measure of how many customers or subscribers leave a service over a given period of time. It's also sometimes referred to as "attrition rate".
There are a few different ways to measure churn rate. The most common method is to simply take the number of customers or subscribers who cancel their service in a given period of time, divided by the total number of customers or subscribers at the beginning of that period.
Another way to measure churn rate is to take the number of customers or subscribers who cancel their service in a given period of time, divided by the average number of customers or subscribers over that same period of time. This method gives a more accurate picture of churn rate if the number of customers or subscribers fluctuates during the period being measured.
Churn rate is important to businesses because it can indicate whether a company is losing more customers than it is gaining. A high churn rate may be a sign that a company's products or services are not meeting customer needs, or that the company's customer service is poor. A high churn rate can also be a sign of competitive pressure from other companies offering similar products or services.
There are a few different ways to reduce churn rate. One way is to improve the quality of products or services so that they better meet customer needs. Another way is to improve customer service so that customers are more satisfied with the company's service. Finally, companies can try to proactively identify customers who are at risk of canceling their service and take steps to prevent them from doing so.
5. Customer lifetime value
Customer lifetime value (CLV) is a key metric for businesses to measure and track. CLV is defined as the total amount of money a customer is expected to spend with a business over the course of their relationship.
There are a number of ways to measure CLV, but the most common approach is to look at the revenue generated from a customer over time. This can be done by looking at customer purchase history, or by tracking the value of a customer's account over time.
CLV is an important metric for businesses to track because it can help inform marketing and sales strategies. For example, if a business knows that a customer has a high CLV, they may be more willing to invest in marketing and sales efforts to attract and retain that customer. Additionally, tracking CLV can help businesses identify which customer segments are most valuable, and focus efforts on attracting and retaining customers in those segments.
6. Annual recurring revenue
Annual recurring revenue, or ARR, is a measure of a company's expected revenue from its subscription-based services over the course of a year. To calculate ARR, a company simply multiplies its average monthly recurring revenue (MRR) by 12.
ARR is a key metric for subscription-based businesses because it provides visibility into the long-term health of the business. In particular, it can be used to track the growth of a business over time and compare it to other companies in its industry.
There are a few different ways to measure ARR, but the most common is to simply take a company's MRR and multiply it by 12. This provides a good estimate of the company's expected annual revenue from its subscription-based services.
Another way to measure ARR is to take a company's total contract value (TCV) and divide it by the number of years in the contract. This provides a more accurate estimate of ARR, but it can be difficult to calculate if a company has a large number of short-term contracts.
Finally, some companies use a blended approach, which takes into account both MRR and TCV. This provides the most accurate estimate of a company's expected annual revenue, but it can be difficult to calculate if a company has a mix of long-term and short-term contracts.
The best way to measure ARR will depend on the specific business and the data that is available. However, all three methods provide valuable insights into the health of a subscription-based business.
7. Customer Acquisition Cost
Customer Acquisition Cost, or CAC, is a key metric for any business, especially in the early stages. CAC measures how much it costs to acquire a new customer and is a critical factor in determining the long-term viability of your business.
There are a number of ways to measure CAC, but the most important thing is to track it over time and to compare it to other key metrics, such as lifetime value (LTV).
To calculate CAC, you need to track two things:
1. The cost of acquiring new customers (marketing expenses, sales expenses, etc.)
2. The number of new customers acquired during the same period
Once you have these numbers, simply divide the total cost by the number of new customers. This will give you your CAC for that period.
It's important to track CAC over time so that you can see whether your marketing and sales efforts are efficient and effective. If CAC is increasing, it could be an indication that your acquisition efforts are becoming less effective.
There are a number of other factors that can impact CAC, such as the quality of your leads, the sales cycle, and more. But tracking CAC is a good place to start when trying to understand the health of your customer acquisition efforts.
8. Net Promoter Score
Net Promoter Score (NPS) is a customer loyalty metric that measures how likely customers are to recommend your brand or product to others. It's a simple question: "On a scale of 0 to 10, how likely are you to recommend us to a friend or colleague?"
The answer provides valuable feedback about what customers think of your brand or product and can be a leading indicator of future growth.
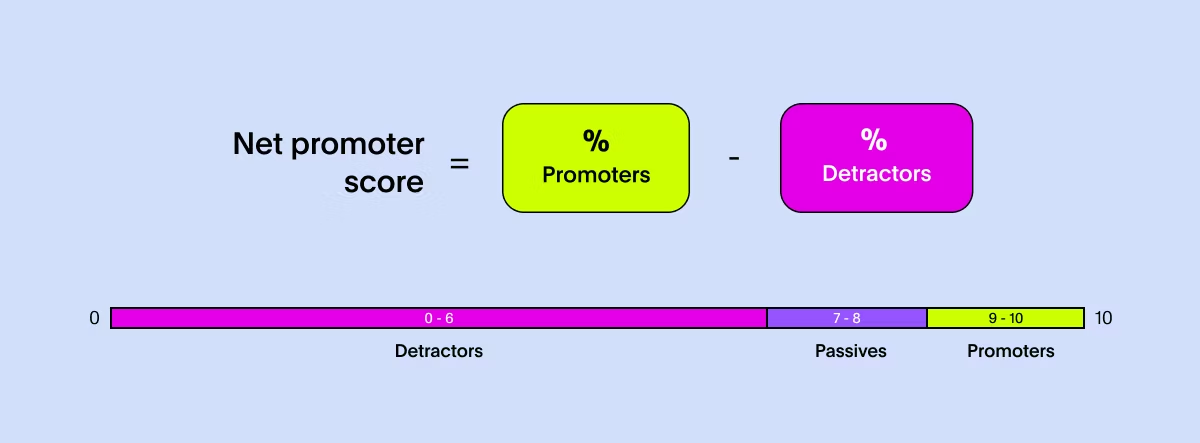
NPS can be calculated by subtracting the percentage of detractors from the percentage of promoters.
Detractors are customers who rate your brand or product 0-6 on the 0-10 scale.
Promoters are customers who rate your brand or product 9-10 on the 0-10 scale.
Passives are customers who rate your brand or product 7-8 on the 0-10 scale.
To get started measuring NPS, simply ask your customers the question: "On a scale of 0 to 10, how likely are you to recommend us to a friend or colleague?"
You can then use this information to improve your products and services, better engage your customers, and drive customer advocacy and future growth.
9. Stickiness
There are a few different ways to measure stickiness, but the most common is through web analytics. This involves looking at things like time on site, pages per visit, and bounce rate. All of these metrics can give you an idea of how engaged users are with your site.
Another way to measure stickiness is through surveys. You can ask users how likely they are to recommend your site to a friend, or how likely they are to come back and use it again. This can give you a more qualitative idea of how sticky your site is.
Finally, you can also look at customer retention rates. This measures how many users come back and use your site after their first visit. A high customer retention rate is a good sign that your site is sticky.
10. Retention rate
Retention rate is a metric that measures the percentage of users who continue using a product or service over a period of time. There are a number of ways to calculate retention rate, but the most common is to take the number of users who were active at the start of a period and divide it by the number of users who were active at the end of that period.
There are a number of factors that can impact retention rate, including the quality of the product or service, customer support, and pricing. In order to improve retention rate, companies need to focus on providing a high-quality product or service and ensuring that customer needs are met.
Measuring retention rate is important for a number of reasons. First, it can help assess the health of a product or service. If retention rate is low, it may be an indication that users are not finding value in what is being offered. Additionally, retention rate can be a valuable metric for evaluating marketing efforts. If acquisition costs are high but retention rate is low, it may not be worth investing in marketing efforts. Finally, retention rate can be used to identify points of friction in the user experience and make changes to improve the overall product or service.
There are a number of ways to improve retention rate. Companies should focus on providing a high-quality product or improving the customer experience. Additionally, they should work to identify and remove points of friction in the user experience. Finally, they should invest in marketing efforts that target potential customers who are likely to find value in the product or service.
11. Feature adoption rate
Feature adoption rate is a metric that helps gauge how quickly users are adopting a new feature or functionality within a software application. Feature adoption rate can be a helpful measure for product managers and engineers when determining whether or not a new feature is being well-received by users and whether it is worth continuing to invest time and resources into developing that feature.
There are a few different ways to calculate the feature adoption rate, but the most common is to take the number of users that have adopted the new feature and divide it by the total number of users that have access to the feature. For example, if 100 out of 1000 users have adopted a new feature, the feature adoption rate would be 10%. Feature adoption rate can also be expressed as a percentage of total users, which in this case would be 10% of all users.
Feature adoption rate can be a useful metric for evaluating the success of a new feature, but it is important to keep in mind that it is just one metric and should not be used as the sole basis for deciding whether or not to continue developing a feature.
Make more informed decisions
In order to be a successful product manager, it's essential that you track the right metrics and KPIs. By tracking these metrics, you'll be able to get a better understanding of your product's performance and make informed decisions about its future. If you're looking for a tool that can help you track all of this data easily, we recommend ThoughtSpot.
Sign up for a free trial today and see how easy it is to find actionable insights in your data.


