


The modern organization expects every employee to make data-driven decisions. Yet, most business users still find analytics tools intimidating, complex, or simply out of reach. The result? Missed opportunities, slow decision cycles, and underutilized data investments.
The challenge is clear: How do we design analytics experiences that let non-technical users explore, understand, and act on data without a steep learning curve or constant IT support?
The answer lies in intuitive, self-service analytics, especially when seamlessly embedded into the business applications users already rely on.
Table of contents:
Traditional BI platforms were built for analysts, not everyday business users. They often require:
Complex data modeling and report building
Knowledge of SQL or proprietary query languages
Navigating dense dashboards with dozens of filters and widgets
This approach creates bottlenecks. Business users either wait for IT to deliver reports or, worse, make decisions with outdated data. Modern organizations need analytics that are as easy to use as a search engine or a chat app. Insights need to be accessible, contextual, and actionable.
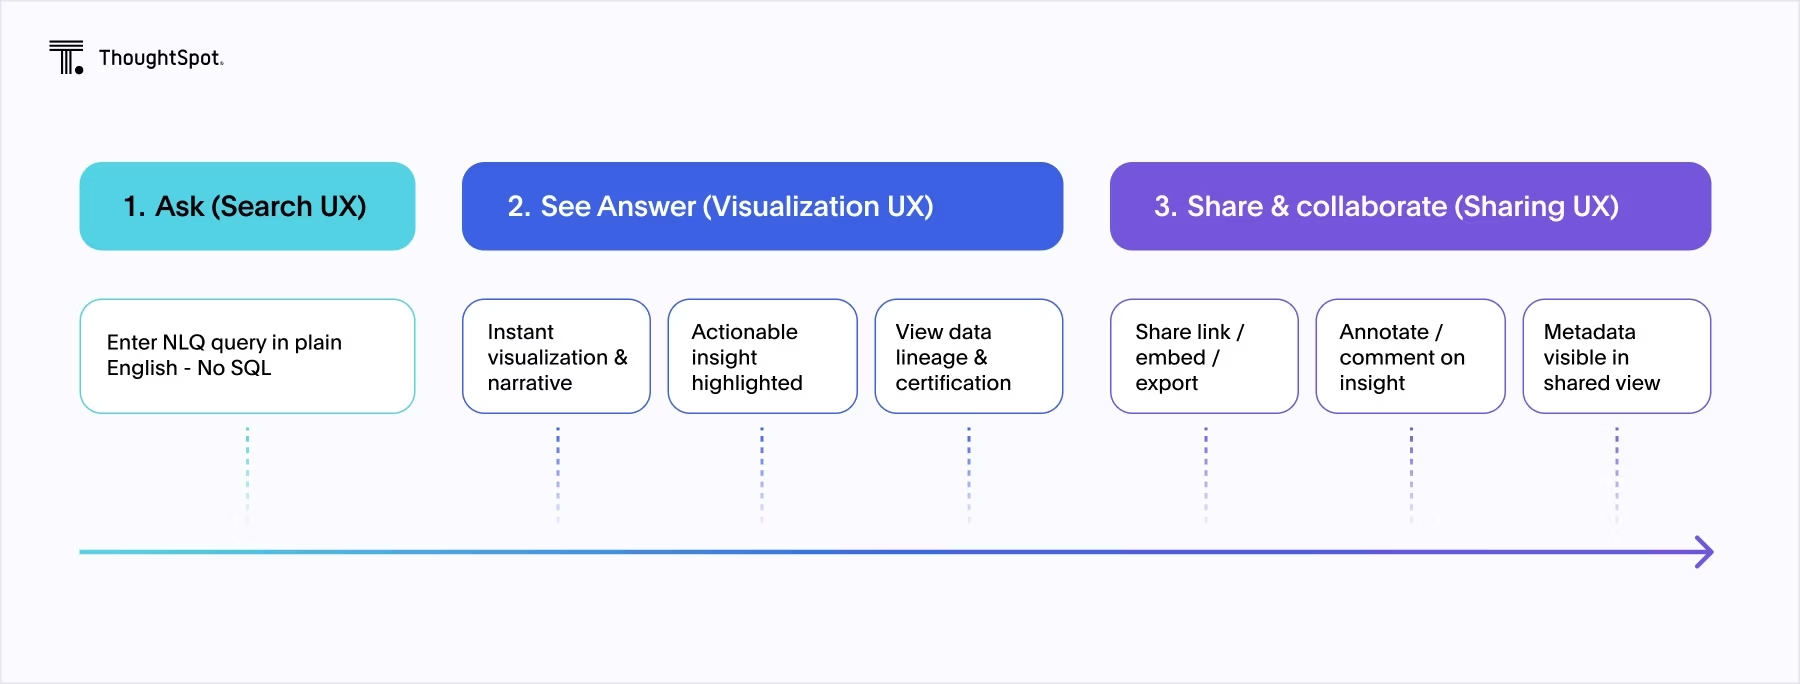
Here's how modern analytics platforms enhance key UX touchpoints across the user journey to make self-service analytics seamless:
Designing analytics for non-technical users isn’t just about simplifying the interface. It’s about rethinking the entire user journey. Here are the core UX principles that drive adoption and impact:
1. Natural Language Query (NLQ) and search-driven experiences
Imagine asking, “What were our top-selling products last quarter?” and instantly seeing the answer. No SQL or training required. NLQ capabilities, powered by AI and large language models, let users interact with data in plain English. This dramatically lowers the barrier to entry and encourages exploration.
Implementation tip: Integrate NLQ directly into embedded analytics modules. Ensure the system can handle synonyms, context, and follow-up questions for a truly conversational experience.
2. Contextual embedding and workflow integration
Analytics shouldn’t be in a silo. Embedding insights directly into business applications such as CRMs, ERPs, or custom portals puts data in the flow of work. Users see relevant metrics and recommendations exactly when and where they need them, driving faster and more informed decisions.
Implementation tip: Use APIs and SDKs to embed analytics components that inherit the host app’s look and feel. Prioritize single sign-on and role-based access to ensure a seamless, secure experience.
3. Guided exploration and automated insights
Non-technical users often don’t know where to start. Features like “auto-analyze,” AI-driven recommendations, and guided Liveboards help users discover trends, anomalies, and opportunities without manual digging.
Implementation tip: Provide overview metrics and highlight actionable insights up front. Use visual cues (e.g., color, icons) to draw attention to outliers or urgent issues.
4. Visual simplicity and progressive disclosure
Cluttered dashboards overwhelm users. Instead, show only the most relevant information first, with options to drill down when needed. Use clear and consistent visualizations such as bar charts, line graphs, and simple tables. Avoid "chart junk" and unnecessary complexity.
Implementation tip: Adopt a “progressive disclosure” approach: start with summary KPIs, then allow users to click for more detail. Tooltips, annotations, and contextual help can guide users without crowding the interface.
5. Data governance and trust
Non-technical users need to trust the data they see. Features like data lineage, certification badges, and clear definitions help users understand where data comes from and how it’s calculated.
Implementation tip: Integrate data governance features into the analytics catalog. Allow users to see who owns a dataset, when it was last updated, and whether it’s certified for use.
Loan Market Group’s approach shows the value of these principles. They made analytics more intuitive for brokers through embedded natural language search and guided Liveboards. By integrating ThoughtSpot into their MyCRM platform, non-technical users could ask questions in plain English, explore trends, and access insights. The result? They saw adoption soar as users found increased value in fast, accessible, in-context analytics.
Even with the right UX, several challenges can derail self-service analytics initiatives:
Data preparation bottlenecks: Upfront data modeling is often required to enable search and NLQ. Modern platforms are addressing this with low-code data prep tools and AI-assisted data wrangling.
Visual exploration gaps: Some platforms lag in flexible, visual self-service. Look for solutions that combine NLQ with robust visual exploration, allowing users to pivot, filter, and customize views easily.
User adoption: Training and data literacy remain critical. Even the best-designed tools need onboarding resources, contextual help, and ongoing support to drive sustained adoption.
Start with high-value workflows: Identify business processes where embedded analytics will have the most impact – sales, customer support, supply chain, etc.
Prioritize integration and security: Ensure analytics modules integrate with existing authentication, authorization, and data governance frameworks.
Invest in data literacy: Pair intuitive tools with training and support to help users build confidence and skills over time.
Leverage AI/ML for augmentation: Use AI not just for NLQ, but for automated insights, anomaly detection, and personalized recommendations.
The next wave of analytics will be even more conversational, contextual, and proactive. Generative AI will automate not just queries, but entire workflows, summarizing trends, generating narratives, and suggesting next steps. As cloud-native architectures and modular analytics components mature, organizations will be able to embed intelligence everywhere, democratizing data-driven decision-making at scale.
Start your self-service analytics journey with ThoughtSpot — book your demo to see how you can empower every user to make smarter, faster decisions.


