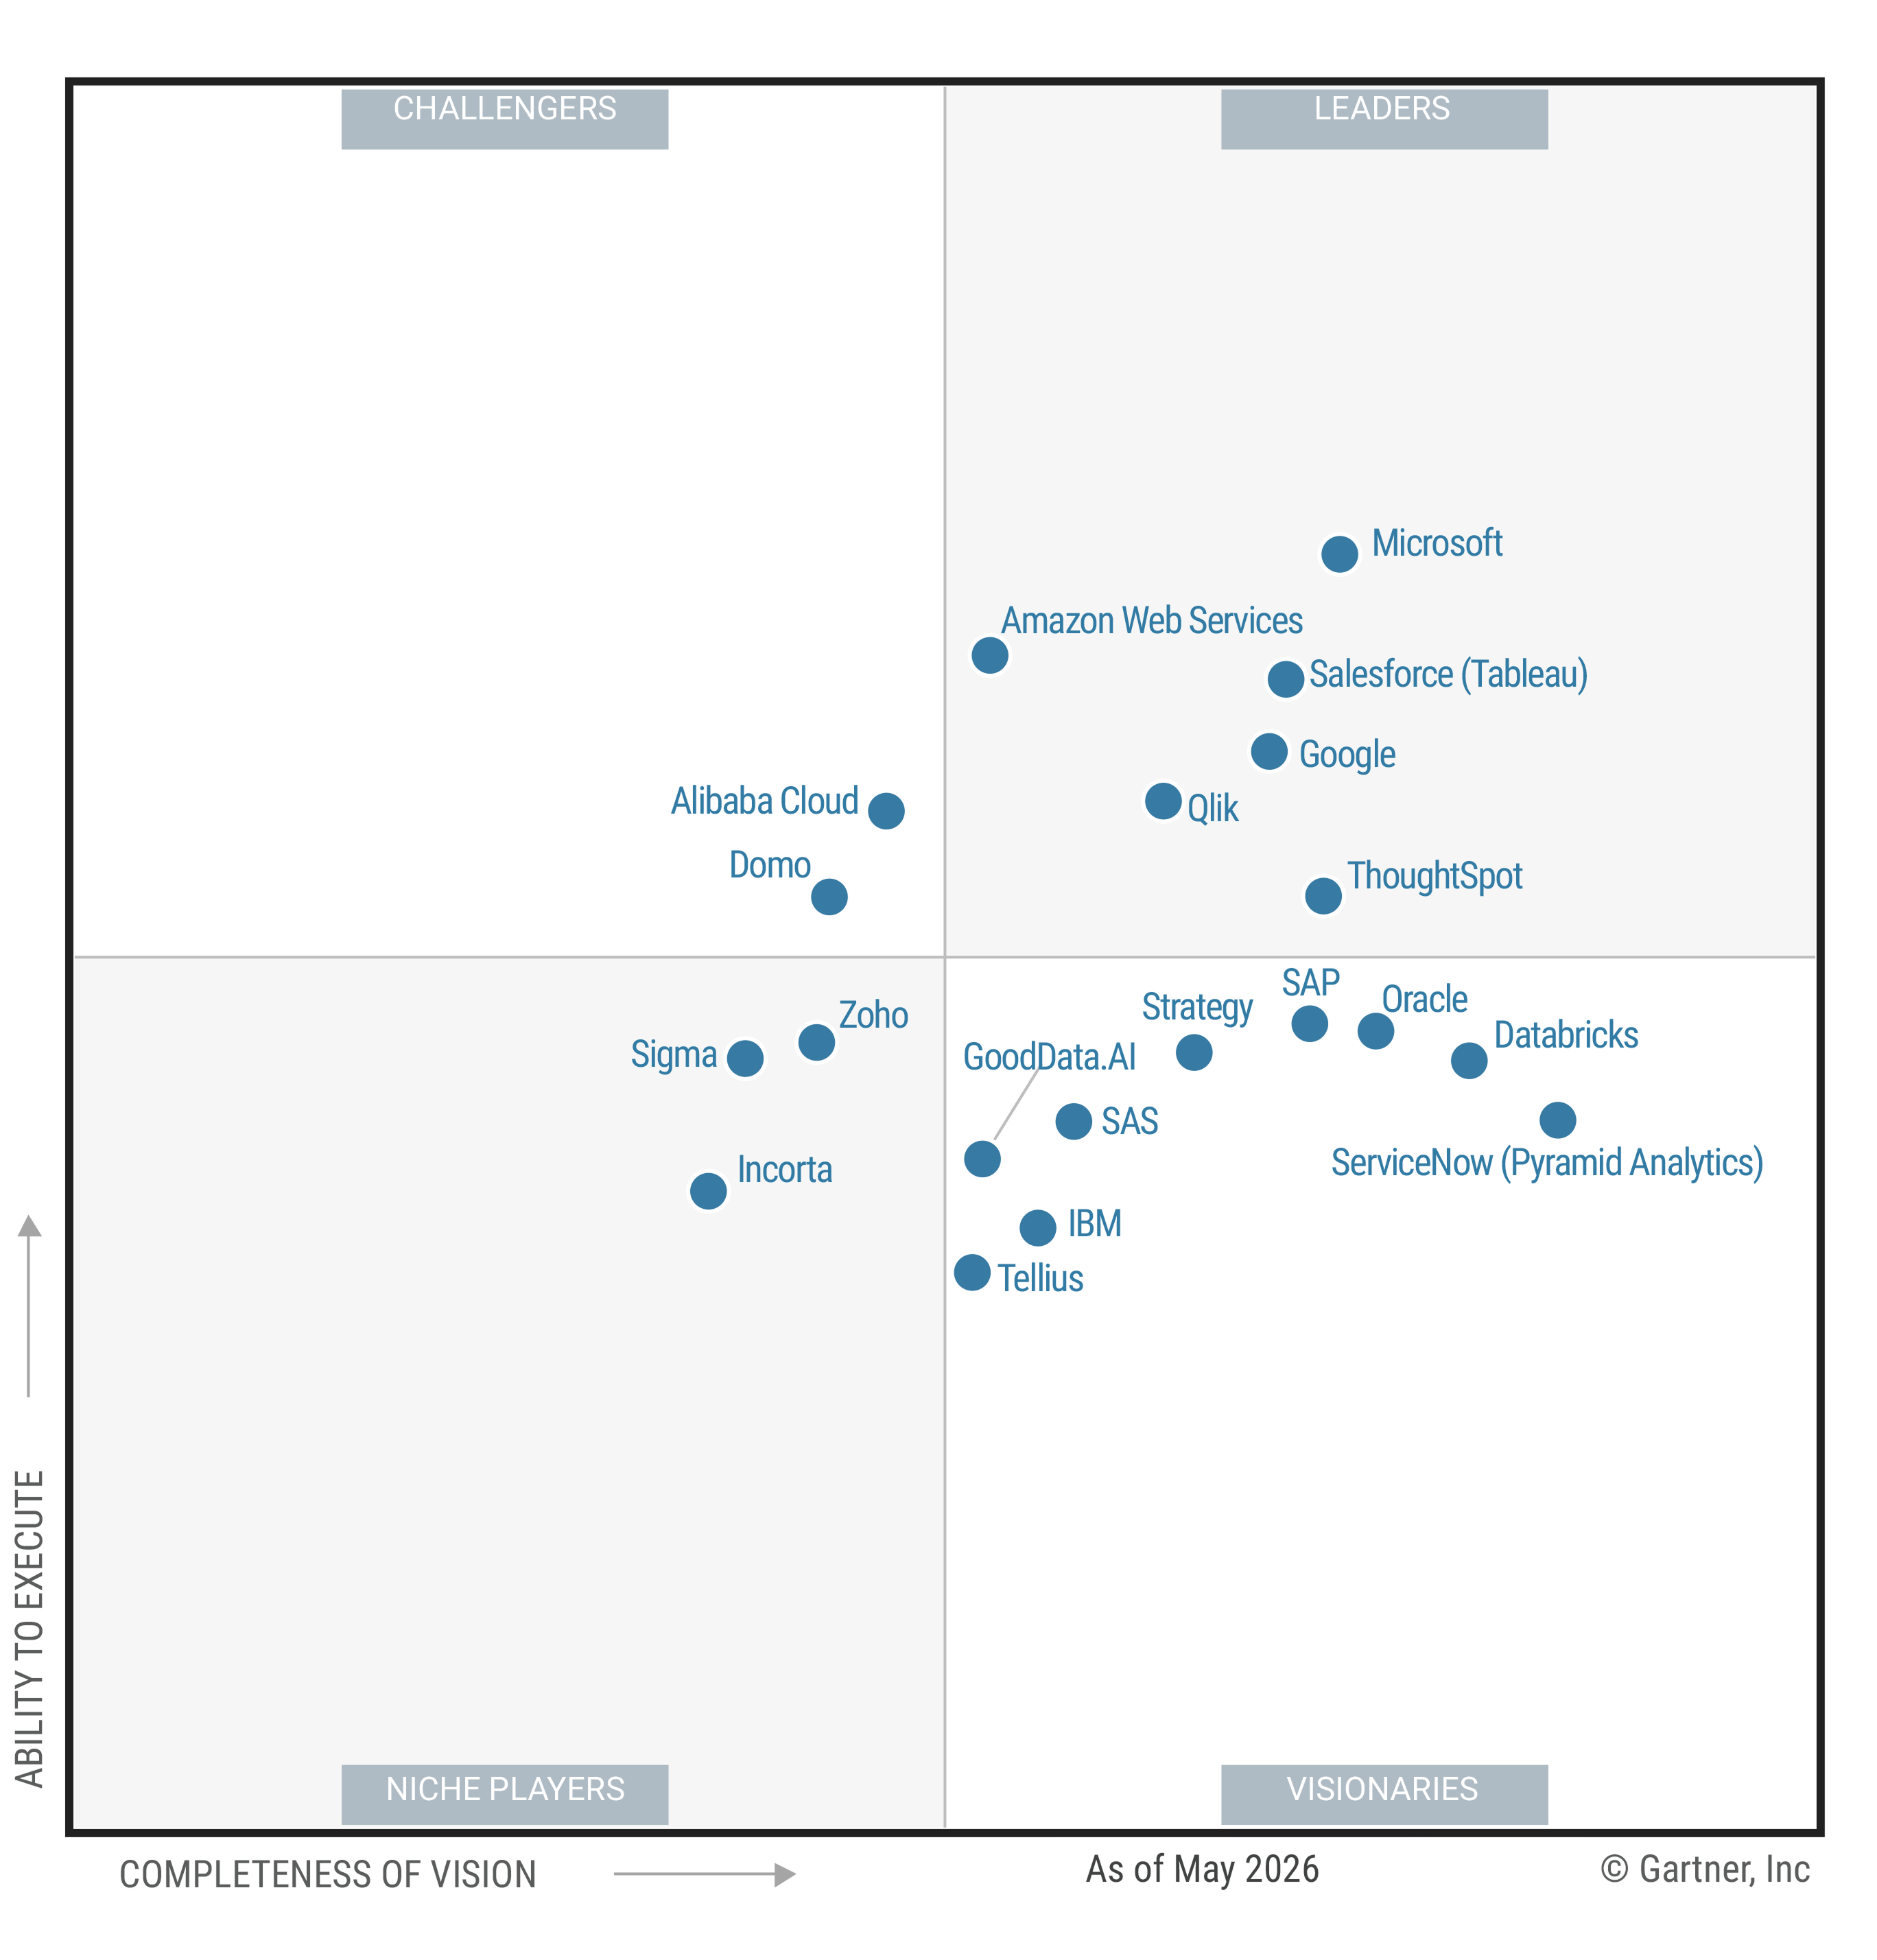
Meta Title: ThoughtSpot Embedded vs. Power BI Embedded Comparison
Meta Description: Compare ThoughtSpot Embedded and Power BI Embedded across features, architecture, governance, cost drivers, use cases, and practical proof-of-concept tests.
Key Takeaways
Consider ThoughtSpot Embedded if your product strategy calls for conversational analytics, interactive data exploration, custom actions, and analytics experiences that feel native to your application.
Consider Power BI Embedded if you want to integrate established Power BI reports and dashboards into customer-facing applications.
Compare architecture, authorization, tenant design, workload patterns, and publishing processes to understand implementation effort and total cost.
Run a proof of concept to evaluate customer workflows, governance, performance, accessibility, and operations using representative data and production-like scenarios.
Choosing an embedded analytics platform can shape your product roadmap for years. A simple feature comparison won't tell you everything you need to know. Two platforms may offer similar-looking dashboards but differ significantly in how users interact with data, how developers integrate analytics, and how teams manage governance and costs.
The right choice depends on the experience you want to deliver. ThoughtSpot Embedded brings conversational analytics, interactive data exploration, and custom actions into your application. Users can go beyond predefined dashboards to explore data and uncover insights. Power BI Embedded, meanwhile, offers an established way to integrate Power BI reports and dashboards into applications.
Understanding these differences will help you choose a platform that aligns with your product strategy, technical requirements, and customer expectations.
Quick Comparison of ThoughtSpot Embedded and Power BI Embedded
Both platforms let you bring analytics into another application. However, the experience they offer users can be quite different. Start by identifying the customer workflows you want to support, then evaluate each platform against the same requirements for usability, architecture, governance, and performance.
The table below highlights the main areas to consider.
| Evaluation Area | ThoughtSpot Embedded | Power BI Embedded | Evidence to Capture |
|---|---|---|---|
| Product fit | Conversational analytics and interactive data exploration | Embedded reports and dashboards | Results from your top three customer tasks |
| User interaction | Exploratory questions and follow-up analysis | Guided report interactions and filtering | Follow-up questions, completion, and errors |
| Embedding approach | Visual Embed SDK and embedded components | App-owns-data or user-owns-data patterns | Setup steps, failures, and recovery results |
| Customization | Configurable embedded analytics experiences | Configurable embedded report experiences | Visual fit, navigation, and responsive behavior |
| Governance | Governed Models, permissions, and access controls | Semantic models, permissions, and access controls | Isolation, permission-change, and audit results |
| Cost evaluation | Current commercial terms and measured operating effort | Capacity, licensing, and operating effort | Expected, growth, and stress scenarios |
| Decision evidence | Representative journeys involving exploration and action | Representative journeys involving reports and dashboards | Production-like proof-of-concept results |
Microsoft's embedded analytics access-token guidance describes two distinct embedding patterns. App-owns-data allows applications to serve customers using application-generated embed tokens. User-owns-data uses each user's Microsoft Entra credentials.
These approaches also have different capacity and licensing requirements. Microsoft specifies A, EM, or P capacity for production app-owns-data deployments. User-owns-data has different requirements and does not support A SKUs.
When comparing the platforms, start with the experience you want customers to have. Then assess the architecture, governance, content management, and commercial requirements needed to deliver it. This approach keeps your evaluation focused on product value rather than vendor terminology.
Embedding Architecture, Developer Experience, and Customization
Your developers will work with the embedding model well beyond the initial implementation. Look at how each platform fits into your front end, release process, data stack, identity system, and observability standards.
ThoughtSpot Embedded Development Model
ThoughtSpot is the Agentic Analytics Platform. ThoughtSpot Embedded brings analytics into customer-facing applications, giving product teams the tools to build interactive data experiences around their products.
ThoughtSpot's Visual Embed SDK documentation describes a JavaScript library for embedding analytics components into web pages. Available components include Liveboards, Spotter, the full application, Search, and a Search bar with a data panel.
You can use the Developer Playground to explore configuration options and generate embed code. Test the integration with your application's identity model and development environments to understand what implementation will involve.
ThoughtSpot's ThoughtSpot Modeling Language (TML) provides a scriptable format for exporting, modifying, and migrating selected metadata objects. Evaluate its REST and version-control workflows for Models, Views, Tables, Liveboards, and Answers as part of your development assessment.
As you assess the development experience, map each component to the product surface where you plan to use it. Test it with representative content, and include environment promotion, error handling, change reviews, and ownership boundaries in your evaluation.
Customization should extend beyond adding your logo. Check typography, colors, spacing, loading states, error handling, navigation, mobile behavior, and how embedded analytics responds to your application's filters.
The goal is to make analytics feel like a natural part of your product. Customers should be able to explore their data without feeling as though they've been redirected to a separate reporting tool.
Read our guide to native embedded analytics design to learn how to create analytics experiences that fit seamlessly into your application.
Power BI Embedded Development Model
Power BI Embedded offers different ways to integrate reports and dashboards into applications. Build a proof of concept using representative content, users, and application states to see how your chosen approach fits your development environment.
Start with Microsoft's embed token guidance to verify token generation for your selected embedding pattern. Test authentication, token scope, expiration handling, and failure recovery within your tenant-isolation design.
Microsoft's report embed configuration documentation covers access-token, embed-URL, report-ID, token-type, and permission settings. The documented permission options include Read, ReadWrite, Copy, Create, and All. Choose permissions based on what users need to do within your application.
During implementation, assign clear ownership of the application shell, analytics content, and hosting resources. Document handoffs and approval steps, then run a controlled content change through a production-like review process.
Developer Questions That Expose Hidden Work
Use the same questions to evaluate both platforms:
Can developers reproduce the setup without manual steps?
Can you promote changes across development, staging, and production?
Can analytics inherit application context without duplicate configuration?
Can you trace failures across the host application and analytics layer?
Can you test permissions automatically before release?
Can your team customize empty, loading, and error states?
Can the host application handle action callbacks and writeback requirements safely?
Getting an embed snippet to work is only the first step. You also need to know whether your team can maintain the integration across releases, tenants, and different product surfaces.
Conversational Analytics and End-User Self-Service
Embedded analytics delivers the most value when users can answer questions without leaving your product. The important comparison isn't the number of charts or dashboards each platform offers. It's how easily users can move from an initial view to a useful insight or decision.
ThoughtSpot Embedded Exploration
Product teams can explore how conversational analytics and data exploration fit into their applications through ThoughtSpot's embedded analytics capabilities.
ThoughtSpot's embedded Spotter documentation explains how developers can integrate the full Spotter experience into their applications using `SpotterEmbed` and SDK configuration options. This allows product teams to bring conversational analytics directly into customer-facing products, helping users explore data and uncover insights without leaving the application.
Imagine a customer looking at a renewal-risk chart. They may want to investigate a particular region, compare account groups, or understand what's driving a sudden change. With conversational analytics, they can ask follow-up questions and explore trends within the product instead of relying entirely on predefined dashboards.
\[IMAGE: Illustrative pharma inventory application showing conversational data questions and natural-language exploration\]
_Example of conversational analytics integrated into a customer-facing application. Product interface and data are illustrative._
ThoughtSpot's custom actions documentation explains how developers can configure code-based actions in supported embedded menus. Callback actions pass data and metadata to the host page, while URL actions send POST requests to a configured endpoint. The host application is responsible for completing the action flow.
The writeback documentation covers editable input-table changes saved to supported Snowflake, Databricks, and Google BigQuery connections. Embedded support is controlled through an SDK flag. When evaluating writeback, test the required configuration, permissions, concurrent edits, and recovery processes.
These capabilities work best when they're backed by governed data and consistent business definitions. Test how Spotter handles abbreviations, ambiguous terms, follow-up questions, unsupported requests, explanations, and recovery paths using questions your customers are likely to ask.
Power BI Embedded Interaction
Power BI Embedded supports customer-facing analytics through embedded reports and dashboards. Use the same customer workflows you tested with ThoughtSpot to assess how well its reports and configured interactions support everyday analytical tasks.
Ask users to monitor a familiar metric, narrow down the results, investigate a change, and explain what they find. Track task completion, errors, requests for assistance, and any steps that take users outside your application.
Include unexpected follow-up questions in your testing. Note whether users need additional report authoring, configuration, or content changes before they can get the answers they're looking for.
Test Self-Service With Real Tasks
Give participants actual business goals rather than instructions on how to use individual features. Ask them to diagnose a change, compare segments, explain an outlier, and decide what to do next without assistance.
Observe where they hesitate and which questions require help from a data specialist. Measure task completion, time to answer, incorrect interpretations, and the number of times users switch between applications.
A platform may offer plenty of interactive controls but still create friction for your audience. Your proof of concept should demonstrate whether nontechnical users can find reliable answers within the product experience.
Security, Governance, and Multi-Tenant Design
Embedded analytics needs to fit into your application's security architecture. That means coordinating access across identity providers, analytics platforms, semantic layers, and underlying data sources.
One distinction is particularly important: successful sign-in doesn't guarantee correct authorization. Authentication establishes who a user is. Authorization determines which data and actions that user can access.
Test authorization separately from sign-in. Verify that unauthorized requests are denied, permissions are checked on the server, and access controls remain consistent across embed requests, tenant filters, exports, and custom actions.
Tenant Isolation and Identity Context
For customer-facing software, test data isolation at the organization, group, role, and user levels. Include scenarios involving users with multiple roles, users switching organizations, suspended accounts, and administrators who need to impersonate or support customers.
Don't rely solely on interface filters to protect customer data. Critical access controls should operate through trusted server-side and data-layer mechanisms that users cannot bypass by modifying browser state.
Evaluate each platform's tenant and identity model against the same roles, data boundaries, and support workflows. For Power BI Embedded, test the app-owns-data or user-owns-data approach described in Microsoft's documentation.
Governance Beyond Row-Level Access
Data access is only one part of governance. You also need consistent metric definitions, approved content, data lineage, refresh expectations, export rules, audit trails, and a process for retiring outdated analysis.
Test how each platform handles changes to shared definitions. For example, determine whether updating a metric could unexpectedly change what customers see across reports, search experiences, or conversations.
Pay particular attention to exports, which can move governed data outside your application. Review download permissions, file contents, watermarking requirements, retention rules, and audit events.
Custom actions and writeback need similar safeguards. Revalidate user permissions whenever an action runs, log the event, and handle partial failures without exposing data belonging to another tenant.
Security Scenarios for the Proof of Concept
Include negative tests alongside your expected user journeys:
A user attempts to access another tenant's record by modifying a URL.
A cached view remains open after a role change.
An export includes hidden fields or unexpected rows.
A custom action receives altered identifiers from the browser.
A support user switches between customer organizations.
A revoked user attempts to reuse an old session or token.
Review the complete data path rather than just the embedded interface. Even a well-designed analytics experience can introduce security risks if identity context, authorization, or tenant filters aren't consistent across systems.
Pricing, Capacity, and Total Cost Drivers
Licensing is only one part of the cost of embedded analytics. Your total investment also depends on deployment architecture, workload patterns, capacity requirements, engineering effort, and ongoing administration.
For ThoughtSpot, request current commercial terms based on your use case and deployment requirements. Evaluate the proposed pricing alongside expected usage and the resources needed to operate the platform.
For Power BI Embedded, account for the different requirements of app-owns-data and user-owns-data architectures. The two approaches shouldn't be evaluated using the same capacity assumptions.
Microsoft's Azure pricing page states that costs depend on node type and the number of deployed nodes. Actual usage is calculated to the second and billed hourly. Publishing users also require Power BI Pro.
Use these details as inputs when building your cost model. Measure concurrency, data model characteristics, query complexity, refresh frequency, peak usage, engineering effort, administration, support, and reliability requirements.
Build a Workload-Based Cost Model
Use representative traffic and data instead of estimating costs based on an average user. Account for quiet periods, daily peaks, month-end spikes, large tenants, complex queries, refresh windows, and expected growth over the contract period.
Microsoft's capacity planning guidance identifies data models, query count and complexity, hourly usage distribution, refresh rates, and other usage patterns as important planning inputs.
Build expected, high-growth, and stress scenarios using representative load tests. For each scenario, record measured utilization, platform charges, cloud data costs, engineering time, monitoring, support, and incident response.
Compare Operating Models, Not Just Licenses
Standardized reports may concentrate more work within a BI team. Flexible, product-led data exploration may require greater involvement from modeling, product design, and governance teams.
Neither approach eliminates operational work. Identify who will manage these responsibilities and how much time they'll require.
Consider the following recurring tasks:
Creating and reviewing analytics content
Managing models and business definitions
Testing tenant and role changes
Monitoring usage and performance
Responding to failed queries or refreshes
Supporting users who cannot find an answer
Updating embedded components after platform changes
Ask each vendor to confirm the current licensing and deployment requirements for your architecture. Document these assumptions and revisit them once your proof of concept provides a clearer picture of expected workloads.
Use Cases and a Practical Proof-of-Concept Decision Matrix
The best way to choose an embedded analytics platform is to start with the product experience you want to deliver. Your team's familiarity with a platform matters, but it shouldn't outweigh what your customers and developers actually need.
When ThoughtSpot Embedded May Fit
ThoughtSpot Embedded is worth considering if your product strategy calls for conversational analytics and interactive data exploration. Its embedded Spotter capabilities, Liveboards, and custom actions can support workflows where users need to explore data, investigate trends, and act on insights without leaving your application.
Use the SDK, Developer Playground, TML, Spotter, custom-action, and writeback tests discussed earlier to understand the development experience. Evaluate setup, permissions, product styling, handoffs, and operational support against your release requirements.
Customer portals, vertical SaaS products, and action-oriented applications are useful environments for testing these capabilities. Base your final decision on measured user results, governance, architecture, and product requirements.
When Power BI Embedded May Fit
Power BI Embedded may be a good fit if your organization already manages substantial Power BI content and your proof of concept shows that existing assets can support customer workflows effectively.
Measure how much content you can reuse rather than assuming that existing reports will transfer seamlessly into your product experience. Also test identity, documented permission settings, and scenario-specific capacity requirements against your service-level targets.
Remember that familiarity among your BI authors doesn't automatically translate into a good customer experience. Your internal teams may already know Power BI, but your product users may need a different way to interact with data.
Proof-of-Concept Checklist
Our embedded analytics feature checklist provides a useful starting point for defining product requirements. Use the following checklist to turn those requirements into measurable tests.
| Test Area | Practical Test | Evidence to Capture | Decision Question |
|---|---|---|---|
| User value | Complete three common customer tasks without training | Completion rate, time, errors, feedback | Can users answer and act in context? |
| Exploration | Ask expected and unexpected follow-up questions | Successful answers, dead ends, specialist help | Does self-service match real behavior? |
| Product fit | Apply your design system across two product surfaces | Screens, responsive states, exceptions | Does analytics feel native? |
| Development | Build, test, promote, and roll back one change | Steps, owners, time, manual work | Can your team ship safely? |
| Authorization | Run positive and negative tenant tests | Access logs, blocked requests, defects | Is isolation dependable? |
| Governance | Change a shared metric definition | Impact list, approvals, audit trail | Can you control semantic change? |
| Performance | Replay normal, peak, and stress workloads | Latency, errors, saturation, recovery | Does it meet service targets? |
| Operations | Simulate a failed query or unavailable dependency | Alerts, diagnostics, recovery steps | Can support teams resolve incidents? |
| Cost | Map measured workloads to current terms | Assumptions, scenarios, sensitivity | Is cost predictable as usage grows? |
| Accessibility | Navigate key workflows with keyboard and assistive tools | Issues, severity, remediation effort | Can all intended users complete tasks? |
Score each test based on evidence, not enthusiasm. A simple pass, conditional pass, or fail rating makes trade-offs easier to understand and prevents one impressive demo from determining the outcome.
Before making your selection, verify current feature availability, licensing, and implementation requirements in the vendors' documentation. Ask both vendors to review the same architecture, workload assumptions, and success criteria.
Choose an Embedded Analytics Platform That Moves Your Product Forward
Choosing between ThoughtSpot Embedded and Power BI Embedded comes down to the analytics experience you want to deliver to your customers.
If your product roadmap calls for conversational analytics, interactive exploration, and the ability to act on insights within your application, ThoughtSpot Embedded offers a compelling approach. If your requirements focus on embedding established Power BI reports and dashboards, evaluate how its architecture and licensing model align with your needs.
Rather than making the decision based on feature lists or product demonstrations, test both platforms against your actual workflows, data, security requirements, and performance expectations. The results will give you a much clearer picture of which platform can support your product as it grows.
Ready to see what ThoughtSpot Embedded can bring to your product? Request a personalized demo and explore how conversational analytics can become part of your customer experience.