- The right alternative depends on your product architecture, customer exploration needs, tenant model, host-app workflows, ownership plan, and expected usage.
- Power BI Embedded offers programmatic control through JavaScript and TypeScript while hosting reports within iframe boundaries.
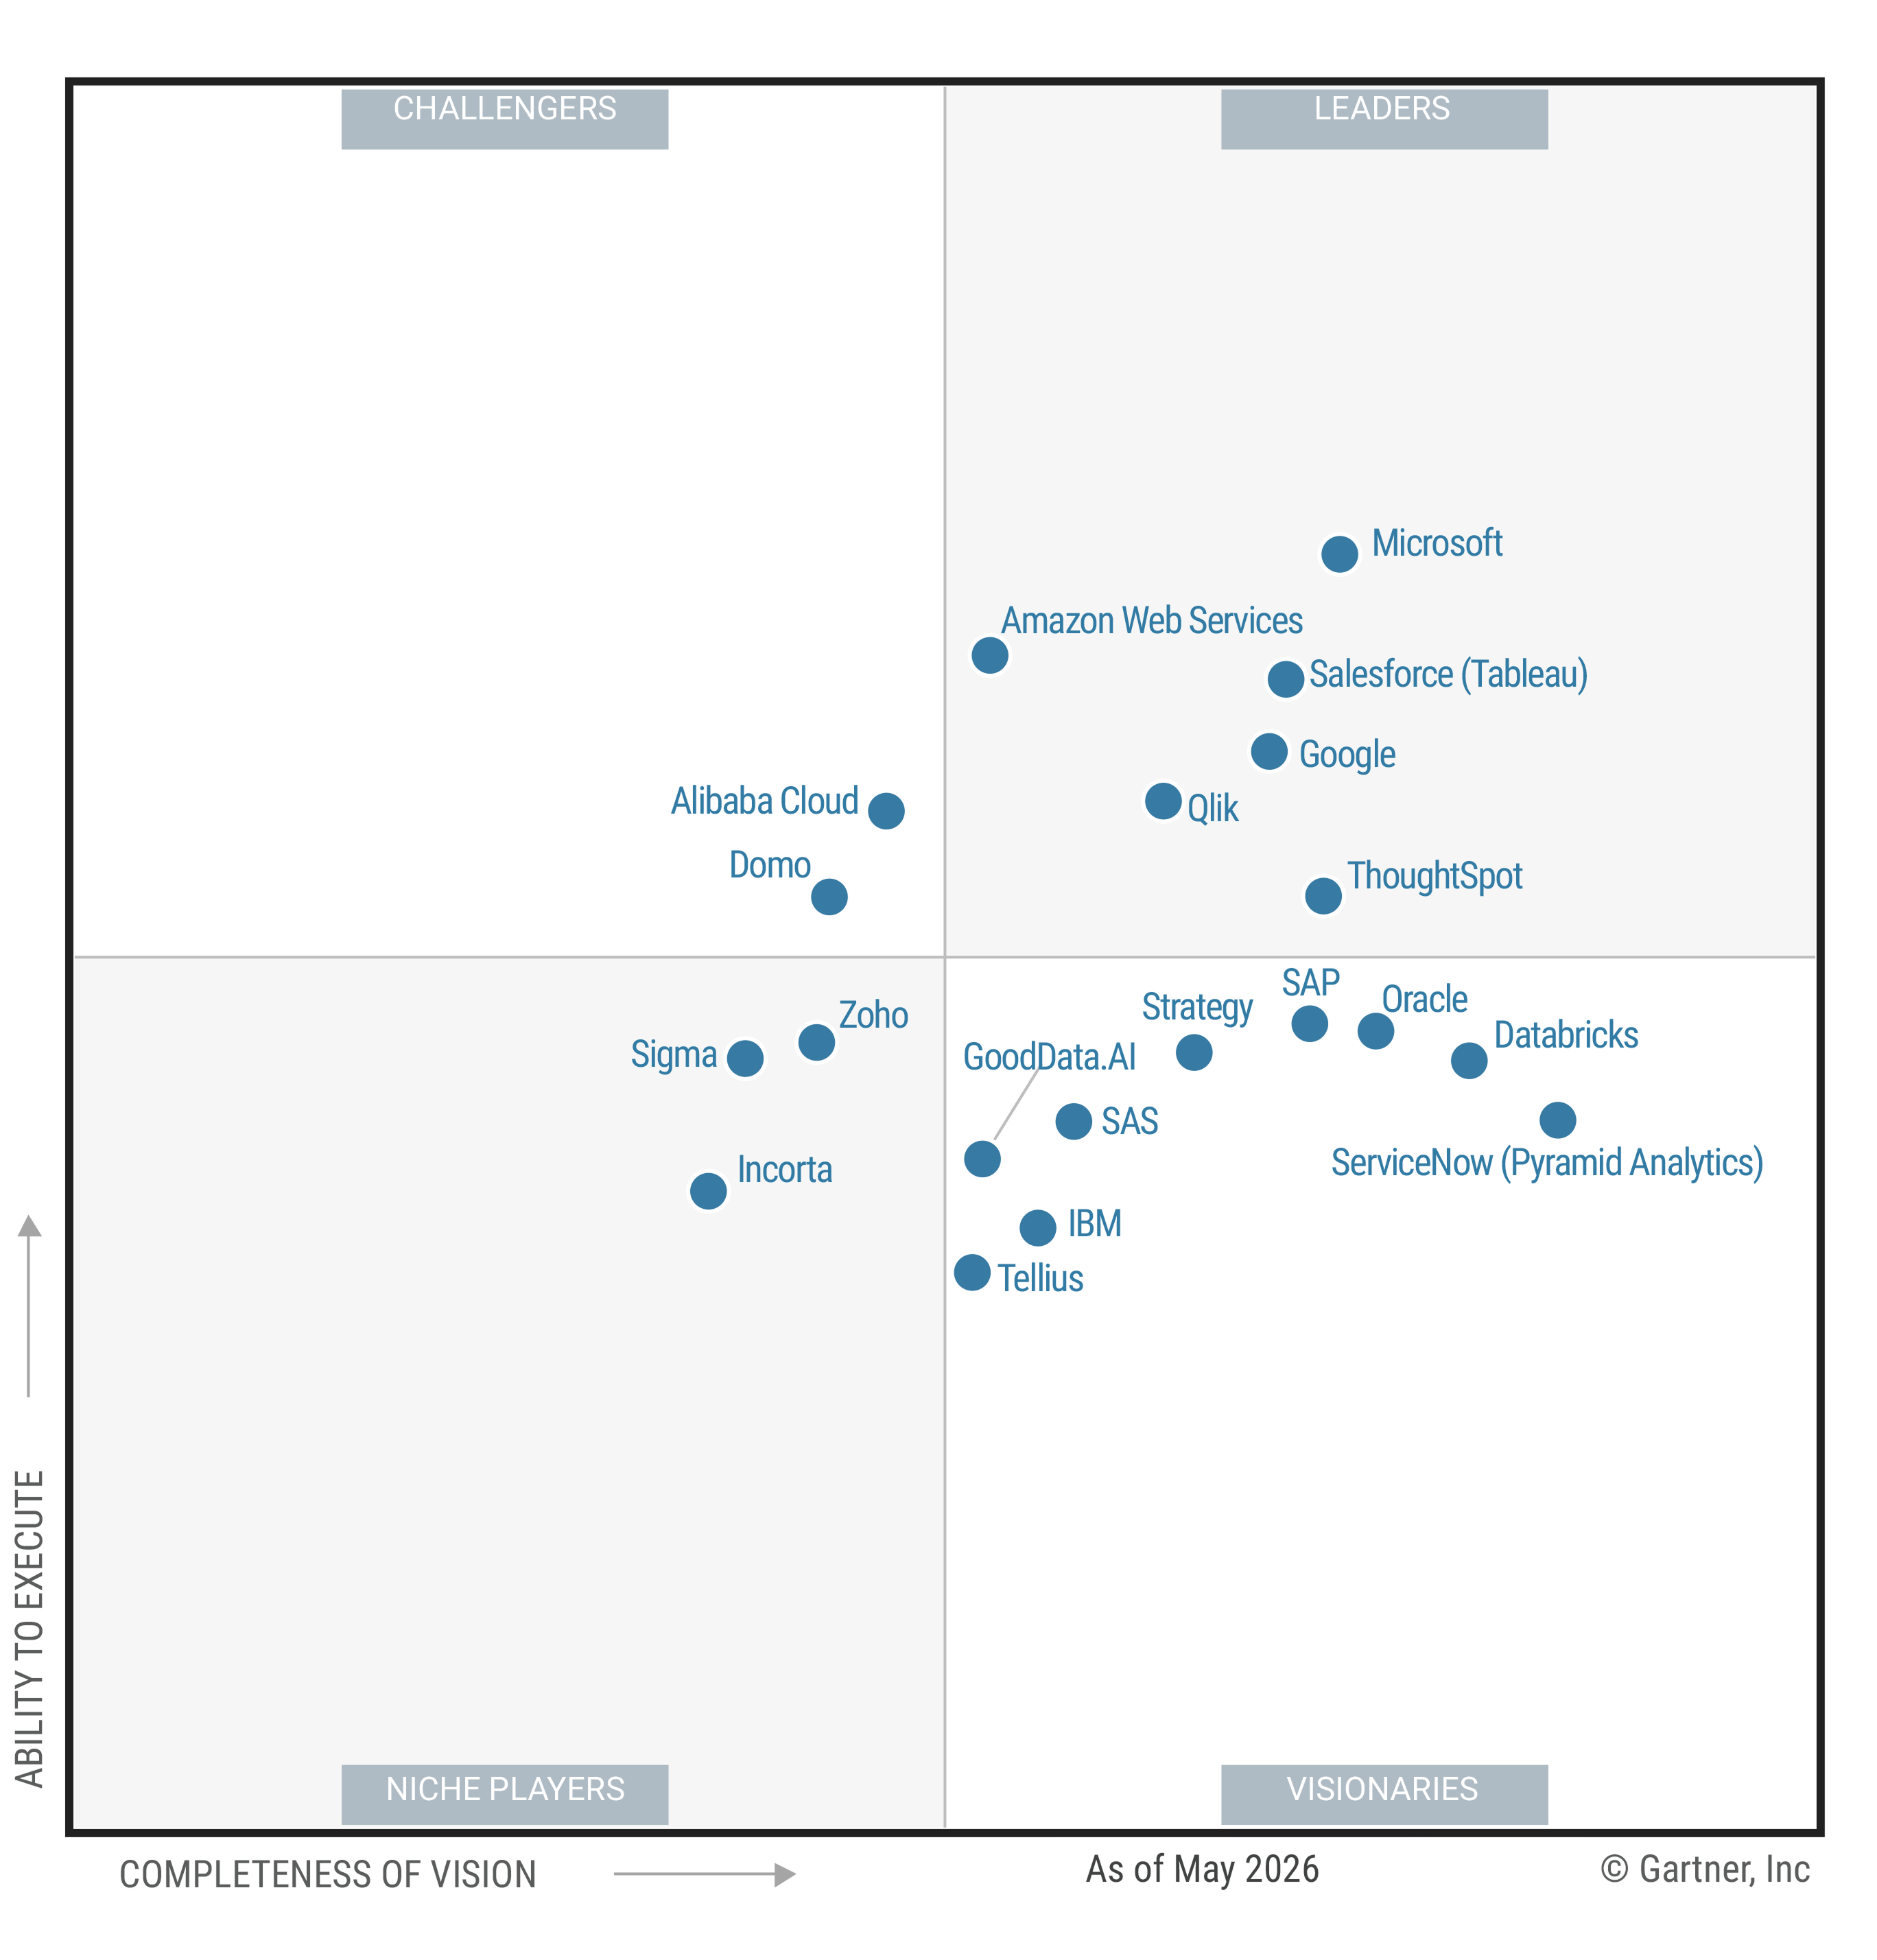
- Compare analytics categories and use cases rather than relying on unsupported vendor rankings.
- Consider workload and operating effort alongside vendor charges, then validate your assumptions using production-like data and traffic.
- Use the same proof-of-concept scorecard for every candidate to make trade-offs easier to evaluate.
Choosing among the best Power BI Embedded alternatives for customer-facing analytics is an important product architecture decision. Your choice affects how customers explore data, how you manage tenant boundaries, how analytics fits into your application, and how much work your team needs to build and maintain the experience.
No single alternative works for every SaaS product. Start with the customer experience you want to deliver, identify the security and integration requirements behind it, and evaluate each option against the same criteria.
When a Power BI Embedded Alternative Fits Your Product
You may be looking to replace Power BI Embedded, complement your existing analytics setup, or determine whether your current implementation is the right fit. The answer depends less on brand familiarity and more on how analytics needs to work within your product.
Power BI Embedded can remain a good choice when its reporting model, Microsoft ecosystem integration, tenant architecture, and capacity requirements align with your needs. Our Power BI Embedded evaluation guide can help you assess the platform based on your product requirements rather than feature counts alone.
An alternative may be worth exploring if customers need more freedom to investigate data, your application requires greater control over the presentation, or you want to change how front-end and analytics responsibilities are divided. A different usage or pricing model may also suit your growth plans, but you'll need workload data to establish whether that is actually the case.
Programmatic Control and Iframe Boundaries
Power BI Embedded does more than display static reports. Microsoft's Power BI Client API provides JavaScript and TypeScript controls for embedded content, while reports themselves remain hosted within iframe boundaries.
This combination supports event handling, navigation, filtering, and other interactions around embedded reports. The important question is how well these controls support the experience you want to build.
Consider how much control your application needs over the surrounding experience. Can it respond to events, preserve state, apply themes, and manage loading behavior? Can users move between analytics and other product workflows without feeling as though they're switching applications?
Identity, Tokens, and Tenant Isolation
In an app-owns-data scenario, Microsoft uses Power BI embed tokens to authorize access to reports and semantic models. These tokens authorize requests to the Power BI service, but they don't replace your application's identity, authorization, or tenant architecture.
Microsoft also documents security approaches that include dynamic row-level security for shared-model filtering and workspace-based isolation for separate customer reports and semantic models. Each approach involves different implementation, administration, and scaling requirements.
Test the complete path from application identity to the data a customer can access. Include user-to-tenant mapping, role changes, token refresh, onboarding, deprovisioning, audit reviews, and failure handling when permissions or tokens are invalid.
Capacity and Workload Planning
Microsoft requires Power BI Embedded capacity for production embedding. The selected capacity determines the compute resources available to your application. Workload planning should therefore be part of product planning, not something left until deployment.
Model concurrent viewers, query complexity, semantic model size, refresh activity, traffic peaks, and customer growth. A small pilot with a few dashboards may tell you very little about how the platform will perform in a busy customer portal with complex filters and uneven traffic.
Avoid making cost comparisons based only on user counts or publicly listed prices. Run load tests, record actual workload patterns, and compare low, expected, and high-growth scenarios against each vendor's current commercial terms.
Use a Product Architecture Framework to Compare Alternatives
A feature checklist can hide the decisions that matter most. One platform may offer extensive data exploration but require more front-end development. Another may simplify report presentation while limiting how analytics fits into your application workflows.
Build a weighted scorecard before reviewing vendor demonstrations. Our embedded analytics platform evaluation guide can help you organize the assessment around product fit, customer behavior, engineering ownership, and operational requirements.
Desired Customer Exploration
Start by defining what customers should be able to accomplish without contacting your support team. Their needs might range from viewing fixed dashboards and changing filters to following drill paths, asking follow-up questions, exploring data in natural language, or creating new views.
The level of exploration you offer affects onboarding, permissions, product tiering, and discoverability. If customers only need a stable weekly report, extensive authoring capabilities may add unnecessary complexity. But if they regularly investigate churn, onboarding, or operational exceptions, fixed dashboards may leave important questions unanswered.
Write down five to ten questions your product should help customers answer. Then test whether each candidate supports those questions naturally for the intended audience, not just for analysts who already understand the data model.
Security Isolation Model
Decide how customer data will be separated before comparing vendor security features. Common approaches include shared models with row-level controls, separate workspaces or projects, separate databases or schemas, and hybrid architectures.
For each approach, document where authorization rules are managed, who maintains them, and how your team will test them. Also consider how administrators will investigate access issues when a customer reports missing or unexpected data.
A security feature label isn't proof of effective tenant isolation. Test real roles and edge cases, including attempts to access data belonging to another tenant. Record the results and the configuration behind them.
Host-App Workflow Integration
Customer-facing analytics often needs to do more than display charts. A user might open a related record, trigger an action, write a value back, or preserve filters while moving between application components.
Map these workflows before comparing APIs. Evaluate events, routing, filters, custom actions, writeback, exports, mobile behavior, and loading states against the tasks customers actually need to complete.
This keeps the evaluation focused on product value. A long feature list won't help if customers have to leave their workflow, rebuild their context, or contact support to finish a task.
Implementation Ownership and Modeled Usage
Identify every layer your team will own after launch. This may include data models, front-end components, tenant setup, content releases, observability, upgrades, customer support, and incident response.
Assign an owner and estimate the effort required for each responsibility.
Your usage model should account for active tenants, concurrent viewers, query volume, refresh patterns, environment count, support effort, and engineering time. Separate vendor charges from internal development and operating costs to understand the full commitment.
Use low, expected, and high-growth scenarios rather than relying on a single forecast. This will help identify where a particular platform becomes harder to operate and when another architecture may be worth considering.
Compare the Three Main Embedding Approaches
Iframe, SDK or API-controlled, and headless or composable approaches describe different ways of dividing responsibility between your application and the analytics platform. They aren't a maturity ladder, and one isn't automatically better than another.
Our embedded business intelligence guide provides additional context on integrating analytics into customer workflows.
As you compare platforms, focus on their documented capabilities rather than assigning each vendor a single label based on marketing descriptions.
Hosted Iframe Embedding
Hosted iframe embedding places a vendor-managed analytics experience inside your application. The provider controls much of the presentation layer, which can reduce the amount of front-end work needed for an initial integration.
However, the browser boundary still matters. Your application may communicate with embedded content through messages or client libraries, but styling, accessibility, navigation, and interaction patterns may follow the provider's implementation.
This approach can work well when your requirements are primarily report-focused and getting an initial release out quickly is important. Test the experience across loading states, screen sizes, authentication transitions, and your main customer workflows.
SDK and API-Controlled Embedding
SDK and API-controlled embedding gives your application programmatic control through client libraries and service interfaces. Your team may manage filters, events, navigation, styling, lifecycle behavior, and workflow actions from the host application.
However, programmatic control doesn't automatically mean the presentation is headless. Power BI Embedded, for example, combines client API controls with iframe-hosted reports. The important distinction is how much control your application has over the embedded content and the surrounding experience.
Evaluate the developer experience alongside the customer experience. Test documentation, local development, error handling, version changes, automated deployment, and the time required to build a complete customer workflow.
Headless and Composable Analytics
Headless or composable analytics provides data and analytics services while your application controls the presentation. Your team may own charting, state management, interaction patterns, accessibility, responsive behavior, and much of the front-end testing.
This level of control can work well for products with distinctive interfaces or specialized workflows. It also increases development and maintenance responsibilities.
Consider whether the additional presentation freedom justifies the engineering effort your team will need to sustain over time.
Don't classify Power BI Embedded or another platform as headless without product-specific documentation. Many analytics platforms combine hosted views, components, SDKs, and APIs in ways that don't fit neatly into one category.
Assess Power BI Embedded Alternatives by Category and Use Case
A ranked list can make the decision look simpler than it really is. Without equivalent evidence for features, security, performance, and cost, a ranking from one to ten may reflect the writer's preferences more than your product's requirements.
Instead, use categories to build a shortlist. Then validate each vendor's claims through current documentation and a proof of concept.
The following table provides a starting point for your research. It is a comparison framework, not a vendor ranking.
| Category | Representative Products to Research | Best-Fit Use Case | Architecture Questions | Proof-of-Concept Checks |
|---|---|---|---|---|
| Embedded-first analytics platforms | ThoughtSpot Embedded and other products documented for customer-facing embedding | Products that need embedded exploration, configurable components, branding controls, and developer workflows | How do components, tenant administration, actions, governance, and release workflows fit your app? | Test real roles, exploration tasks, styling, actions, deployment, and workload behavior. Validate individual vendor claims. |
| BI suite embedding options | Power BI Embedded and other BI suites with documented embedding | Products that favor familiar report workflows, shared administration, or alignment with an existing data stack | How do tenant design, SDK depth, customization, licensing, and content management work? | Test host-app control, tenant setup, report lifecycle, capacity, and administrator tasks. |
| Headless and composable analytics services | Products with documented service APIs or composable presentation models | Products that want the host app to own more of the interface | Which data, query, semantic, charting, accessibility, and state layers remain with your team? | Build one production-like workflow and measure front-end scope, test coverage, and ongoing ownership. |
| Custom analytics builds | Your internal analytics architecture | Narrow, stable requirements that justify direct ownership | Who owns modeling, queries, caching, charts, tenancy, exports, governance, and support? | Build the hardest workflow, run tenant tests, load-test it, and estimate ongoing engineering work. |
Embedded-First Analytics Platforms
In this comparison, embedded-first analytics platforms refers to products designed for customer-facing analytics, with an emphasis on branding, administration, and developer workflows.
If ThoughtSpot Embedded is on your shortlist, evaluate it using the same proof-of-concept scorecard as the other candidates. Test it with your own data, permissions, customer workflows, and release processes.
BI Suite Embedding Options
BI suite embedding brings an established reporting environment into customer-facing applications. This category may be a good fit when shared administration, familiar report development, or alignment with an existing data stack are important priorities.
The trade-offs depend on the platform. Examine tenant setup, customization, client library capabilities, deployment workflows, content management, and current licensing requirements. Don't assume that an internal BI experience will automatically translate into a good external customer experience.
Ask both analysts and product engineers to participate in the proof of concept. Their combined feedback will help you determine whether familiar reporting workflows reduce operational effort or introduce friction for customers.
Headless and Composable Analytics Services
This category gives your host application greater responsibility for the presentation layer. Depending on the service model, your team may work with semantic queries, APIs, component libraries, or lower-level data services while controlling the final interface.
The main advantage is flexibility. The trade-off is the additional work involved in chart behavior, accessibility, responsive layouts, application state, error handling, exports, and front-end testing.
A polished prototype can hide the ongoing work involved. Consider what happens when a metric changes, a tenant adds a new role, a browser update affects rendering, or customers request another way to explore their data.
Custom Analytics Builds
An internal analytics build is another option, but it isn't a cost-free alternative.
Your team may need to own semantic modeling, query generation, charting, caching, tenant controls, exports, observability, accessibility, governance, support, and ongoing feature requests.
Custom development can make sense for narrow, stable requirements, especially when analytics is closely tied to a unique product workflow. It becomes more demanding when customers expect open-ended exploration, frequent content changes, or extensive administration and governance features.
Estimate the long-term roadmap cost, not just the initial development effort. Include maintenance, upgrades, support, incident response, and engineering time that would otherwise go toward your core product.
Validate Your Shortlist With a Proof of Concept
A useful proof of concept should test your product requirements, not just a vendor's polished demonstration.
Select two or three representative tenant profiles, realistic permission roles, appropriate data volumes, expected peak concurrency, production-like workflows, and a credible deployment path.
Evaluate every candidate against the same acceptance criteria. Document customer experience, security boundaries, implementation effort, operational ownership, and modeled usage so product, engineering, data, and finance teams can review the results together.
Test Customer Exploration and Product Workflows
Ask representative users to complete the same tasks in every candidate. Include viewing a dashboard, following a drill path, asking a follow-up question, applying filters, exporting permitted data, and triggering an in-app action.
Record task completion, points of confusion, support requests, and situations where users leave the workflow.
If ThoughtSpot Embedded is one of your candidates, test it using the same customer tasks, data, and acceptance criteria as every other option.
Include edge cases in your test script. Check empty results, ambiguous questions, restricted data, large result sets, expired sessions, and scenarios where customers change filters several times before taking action.
Test Tenant Boundaries and Administration
Test tenant creation, user provisioning, role changes, row access, object access, token expiration, deprovisioning, audit reviews, and administrator troubleshooting.
Include negative tests that attempt to retrieve or display data belonging to another tenant.
Document which controls belong to the analytics platform and which remain within your application, identity provider, data layer, or deployment process. The division of responsibility should be clear enough for developers to maintain and administrators to investigate.
Repeat these tests after changing a role or tenant configuration. Security behavior that works during initial setup may not remain reliable as your customer structure evolves.
Test Branding and Presentation Fit
Customer-facing customization goes beyond colors and logos. It includes typography, spacing, responsive behavior, loading states, empty states, errors, accessibility, and consistency with the rest of your application.
Our white-label analytics guide can help you evaluate branding requirements alongside the broader product experience.
The image above is illustrative. It shows how analytics and styling controls can sit within a customer-facing application. It does not establish performance, customer outcomes, reviews, or feature availability.
Test branded components alongside your actual navigation, forms, alerts, and account controls. Pay attention to focus order, keyboard behavior, color contrast, content overflow, mobile layouts, and visual consistency between your application and the embedded experience.
Test Workload and Operating Economics
Run representative load tests and document query latency, concurrency behavior, capacity changes, caching assumptions, refresh activity, alerting, and support procedures.
Use traffic patterns that reflect your actual product, including peak periods and uneven activity across tenants.
Compare low, expected, and high-growth scenarios. Add internal engineering and support costs to vendor charges so that each scenario reflects the full operating commitment rather than just the contract price.
Keep results tied to the configuration you tested. Performance measurements from one data model, region, traffic pattern, or caching setup shouldn't become a general ranking of vendors.
Choose the Alternative That Fits Your Product Roadmap
Start with the customer questions your product needs to answer. Then define your tenant isolation model, determine how much control your host application needs, assign implementation responsibilities, and model expected usage.
Once you have those requirements, run the same proof of concept across your shortlist.
The strongest choice is the platform that fits your product roadmap and operating model. A longer feature list can't replace a reliable tenant architecture, a smooth customer experience, or an ownership plan your team can sustain after launch.
If ThoughtSpot is on your shortlist, evaluate it against the same criteria for customer experience, tenant boundaries, host-app workflows, and operational requirements.
Explore ThoughtSpot Embedded to see how embedded analytics can support your customer-facing product.