

You rely on charts to make decisions fast. But what if the data story they tell is wrong?
Misleading graphs are common in everything from pitch decks to performance dashboards. Sometimes it's due to poor design. Other times, the goal is to sway opinion or obscure the truth. Either way, the result is the same: distorted insights and costly decisions.
In this guide, you'll learn how to spot the most common types of misleading charts, understand how they work, and make sure your own visuals tell the full story.
What Makes a Graph Misleading: Common Types (with Examples)
Let’s take a look at some of the most common examples of misleading charts and graphs that you might encounter, and some red flags that can identify them.
Manipulating the Y-axis / Missing Baseline
Our first type of bad graph is one of the most common: A chart with a misleading y-axis.
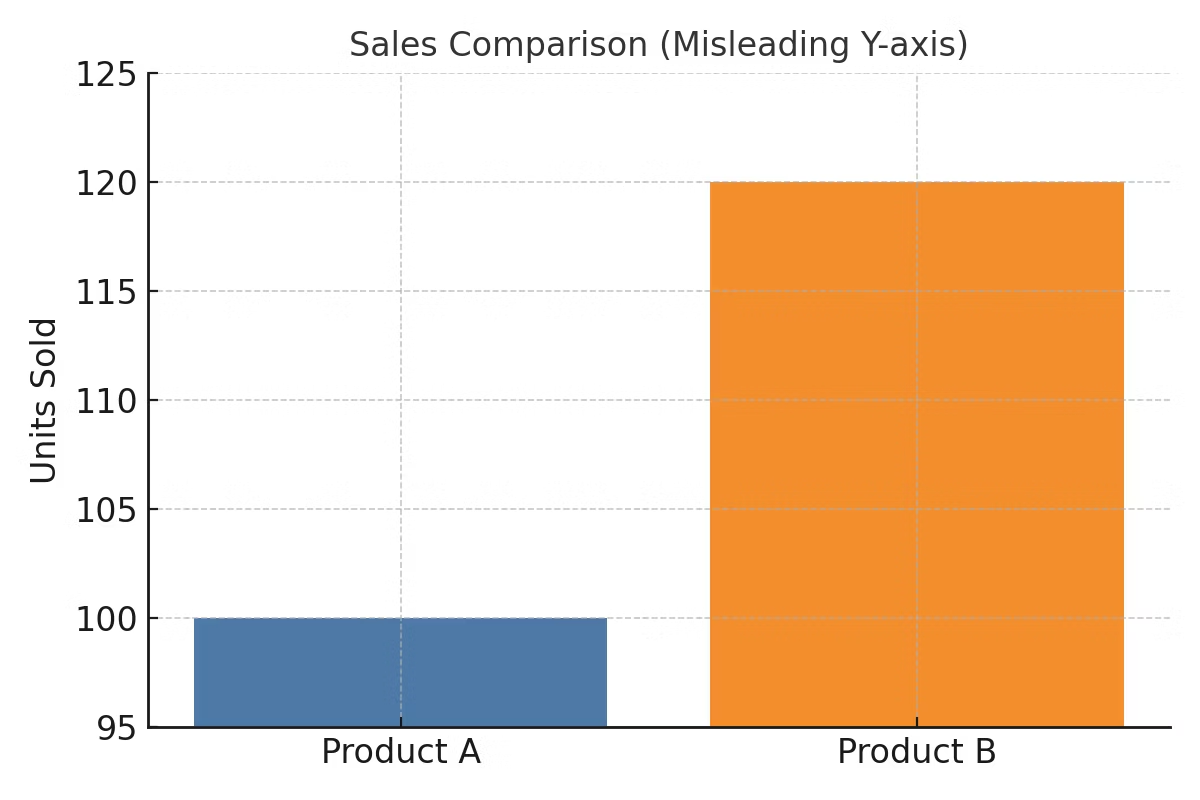
At first glance, it looks like Product B is massively outselling Product A. In reality, the difference is only 20 units—but it looks like much more because the Y-axis starts at 95. Here’s a version without the compressed Y-axis.
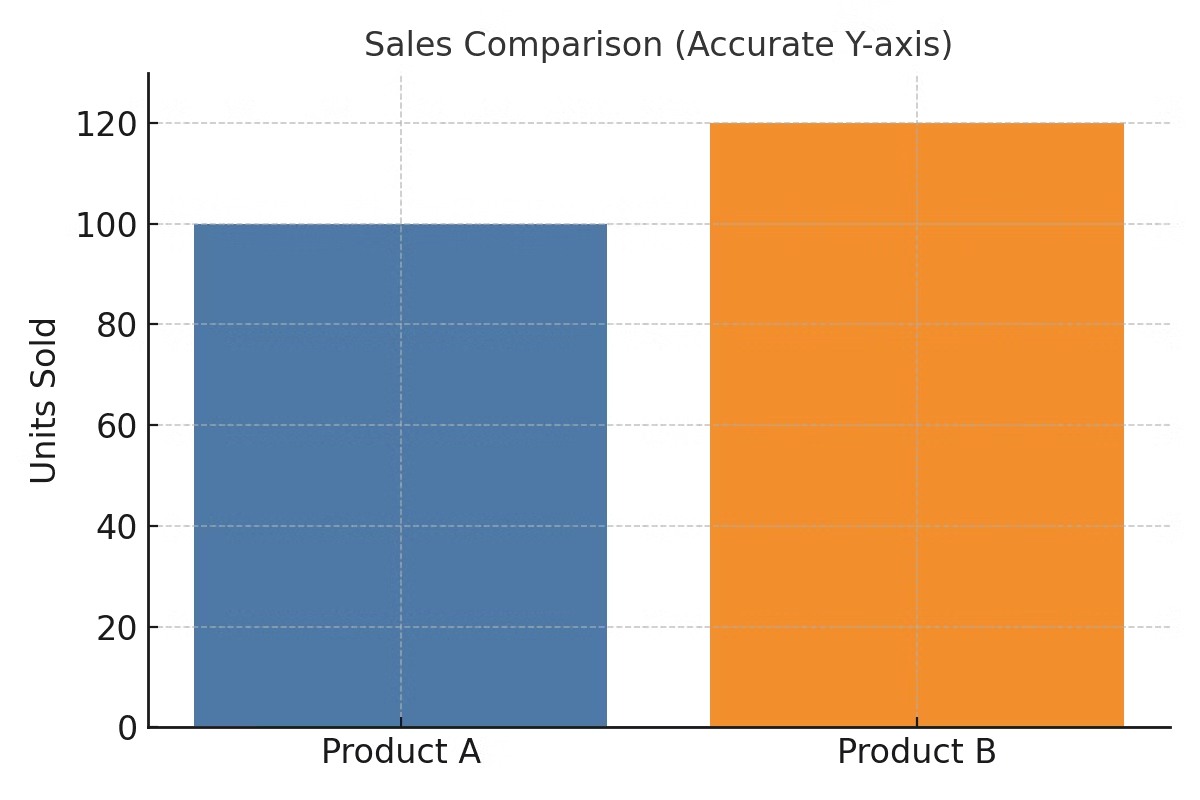
Nothing has changed about the data: Product B is still outselling Product A by 20%, but this graph puts things in proportion.
Example Scenario: You’re evaluating a vendor and looking over their marketing materials. You spot a graph that seems to show a massive difference in cost savings between the vendor’s product and a competitor’s. On closer inspection, they’ve started the graph so high that a relatively minor difference looks like a big jump—so you scratch the vendor off your list.
💡 Tip: If you're designing a bar chart that compares values, always ask: Does this Y-axis tell the full truth?
Dual or Multiple Y-Axes
Plotting two different metrics with separate scales on the same graph using multiple Y-axes is another common way to create a misleading graph.
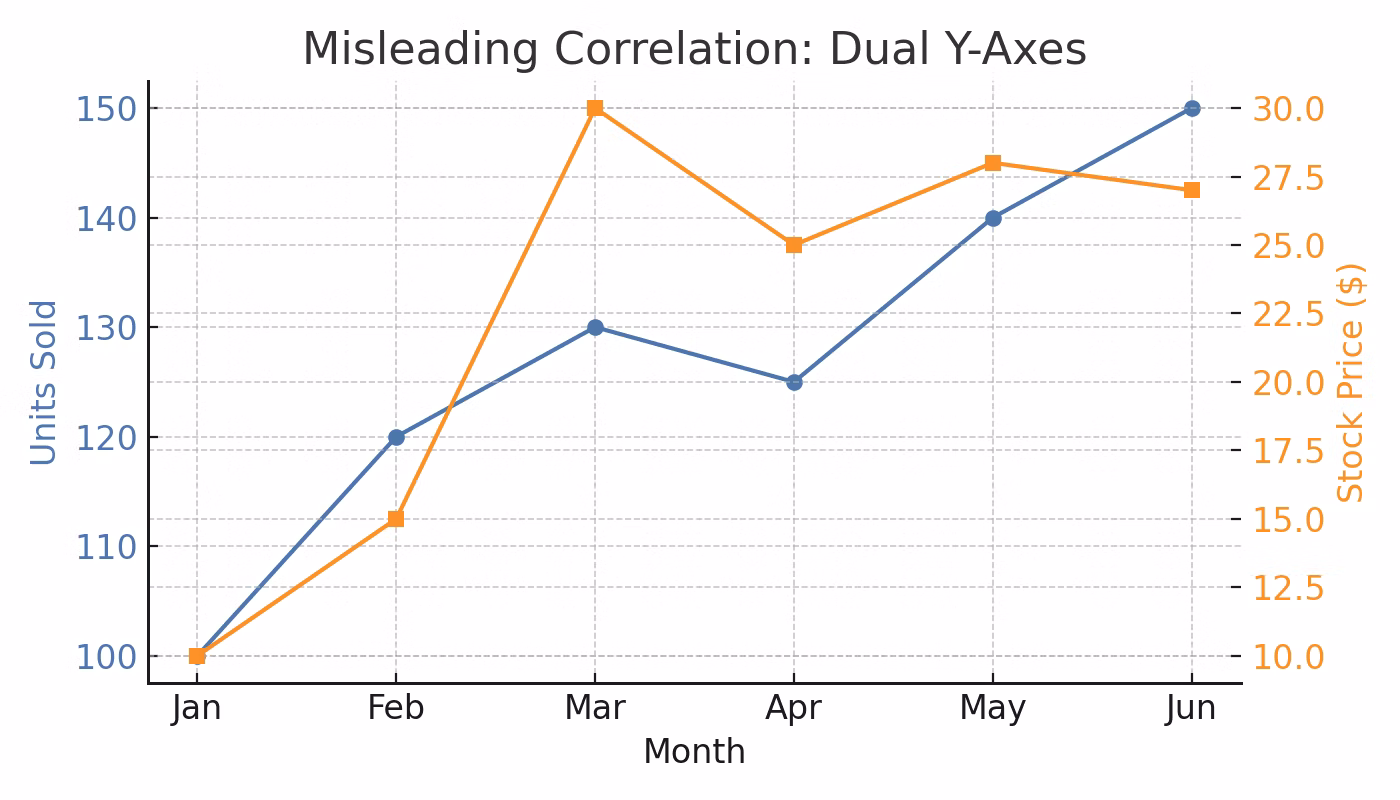
In this line graph, it looks like there’s a fairly strong degree of correlation between units sold and stock price. However, the scales aren’t proportional:
An increase of 100 to 150 is only a 50% increase in units sold, while an increase from a $10 to a $27.50 stock price approaches a 200% increase in value. That means increases and decreases between one point and the next may be less significant than they appear.
Let’s look at the trends again in this second graph, where the two scales are normalized into a single metric:
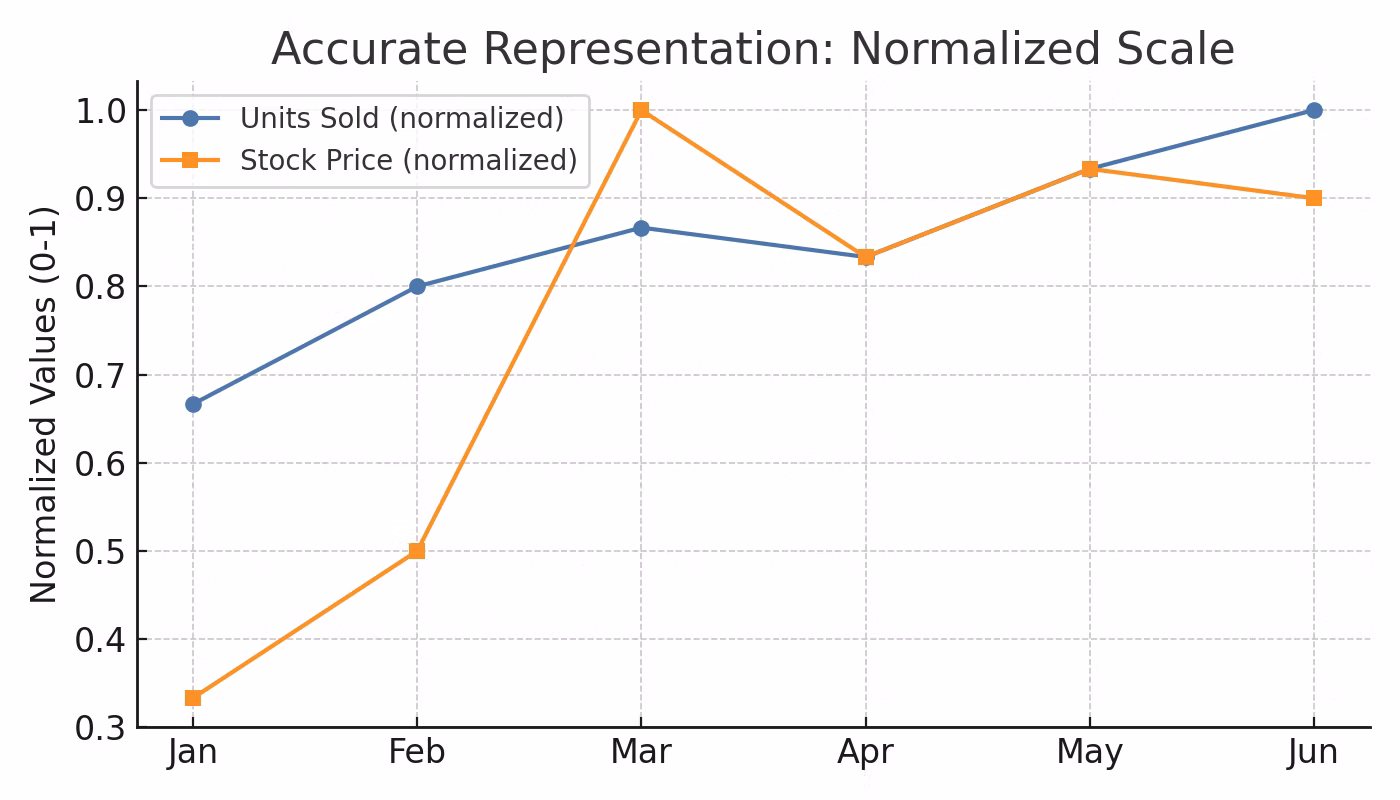
Here, because both metrics are on the same scale, you can get a more objective understanding of how they move together. There may still be a correlation, but you won’t know until you’ve seen a chart where the values are plotted on a comparable scale.
Example Scenario: During your monthly check-in with the team you’ve hired to manage paid media marketing, they show a graph that seems to demonstrate a robust rise in sales correlated with ad campaign spend. Rather than increase their budget automatically, you ask them to normalize the values and show you again, so you can verify that the correlation is real and not an artifact of the graph.
💡 Tip: If you’re analyzing data, always question whether two metrics actually belong on the same visual in the first place.
Start Getting Better Insights
Cherry-Picking Data / Selective Timeframes
Then there’s cherry-picking: Showing a subset of data that supports a certain narrative, while leaving out other necessary contextual data. Consider this line graph of quarterly revenue:
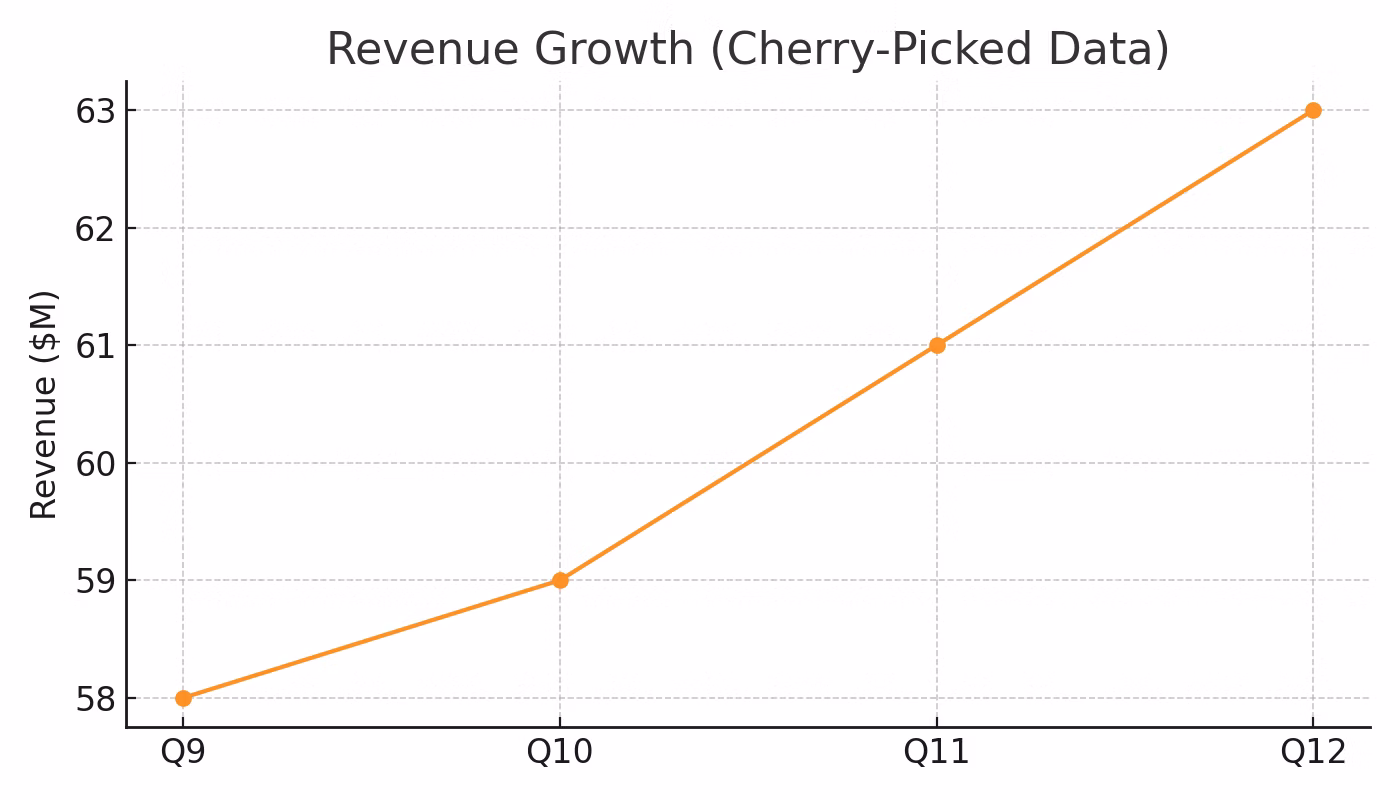
Four straight quarters of growth look pretty strong. However, the context is relevant, too:
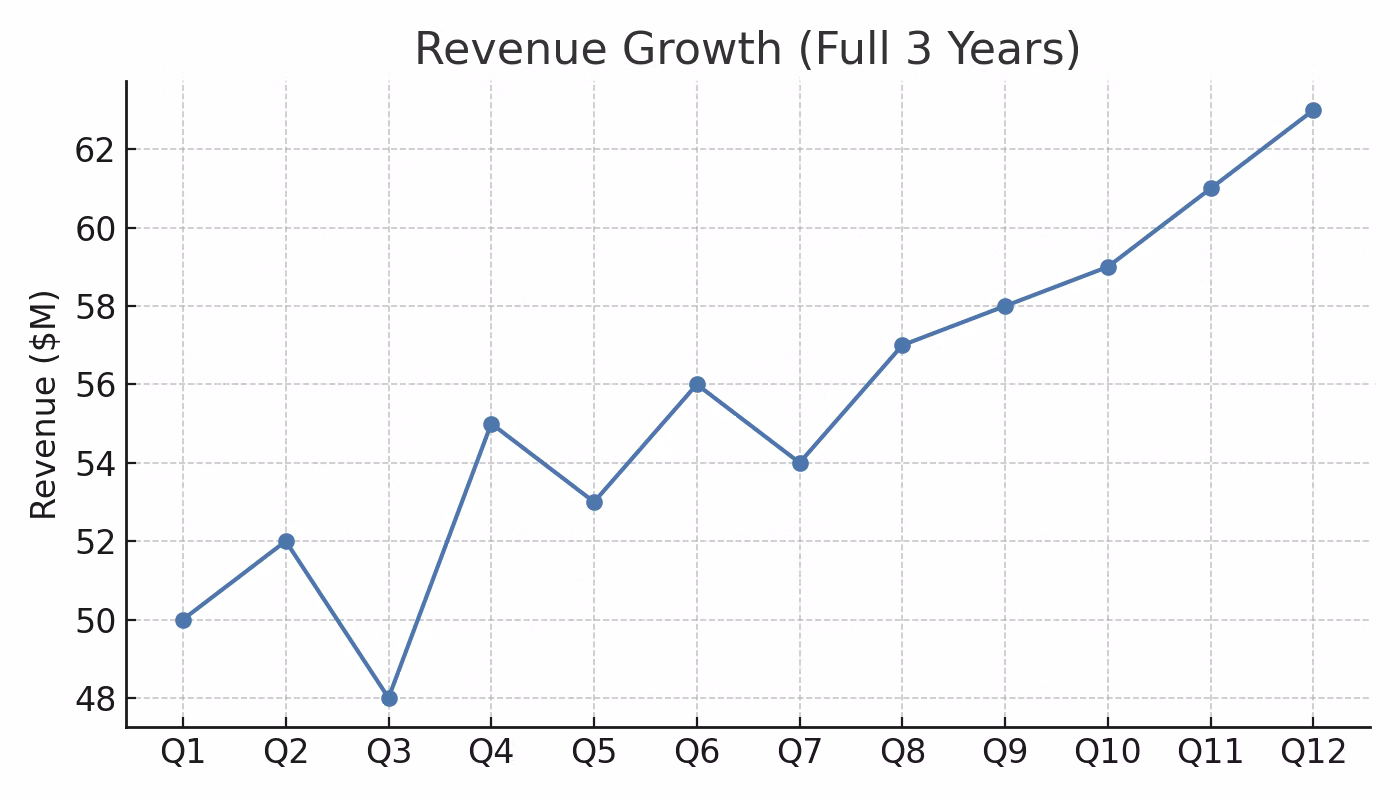
The full picture is more complicated. Again, deception doesn’t have to be involved: Maybe the company really is on an upward trend after stabilizing its revenue model. Or maybe it’s being pitched as a safe investment, when a more accurate picture shows some significant volatility.
Some cherry-picking might focus on specific customer segments, top-performing products, or outlier deals that are much bigger (or smaller) than the typical size. No matter which metric is being used, it’s critical to look at which data might be omitted from a given graph and ask yourself if there might be a story you’re not being shown.
Example Scenario: You’re an investor looking at a pitch deck full of impressive-looking deals. However, after some research, you discover that most of the company’s deals are less than half this size—and all of these big successes happened several years ago. You pass on the opportunity or request more information about recent deals.
💡 Tip: If you're responsible for presenting trends, make sure your timeframes reflect the full context, not just the best story.
Improper or Non-Uniform Scale Intervals
Unequal spacing or a non-uniform scale on graphs is another way to distort the message of a visualization. Here’s a graph that seems to show several years of consistent growth:
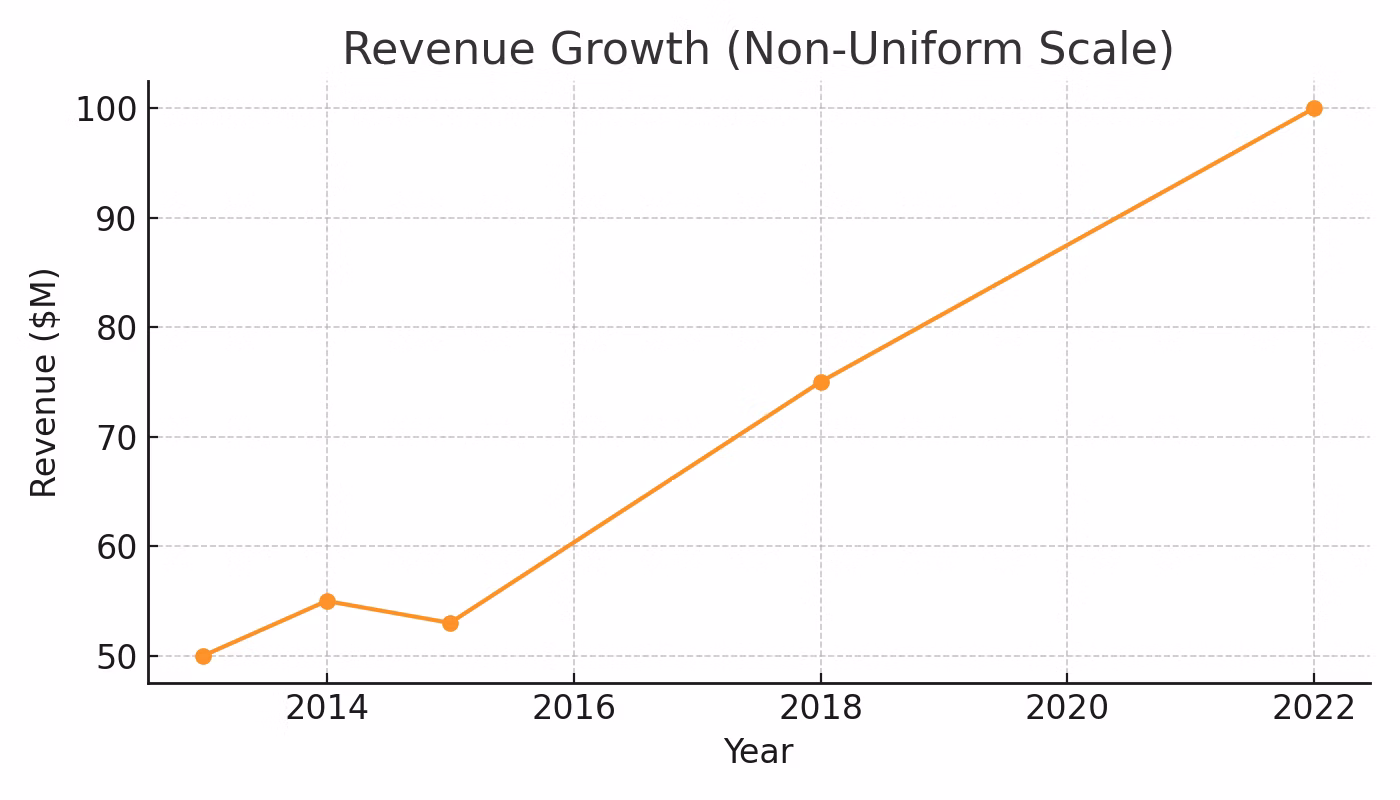
On closer inspection, you’ll see that the data points are plotted in strange, almost random places. That’s because a more accurate graph would look like this:
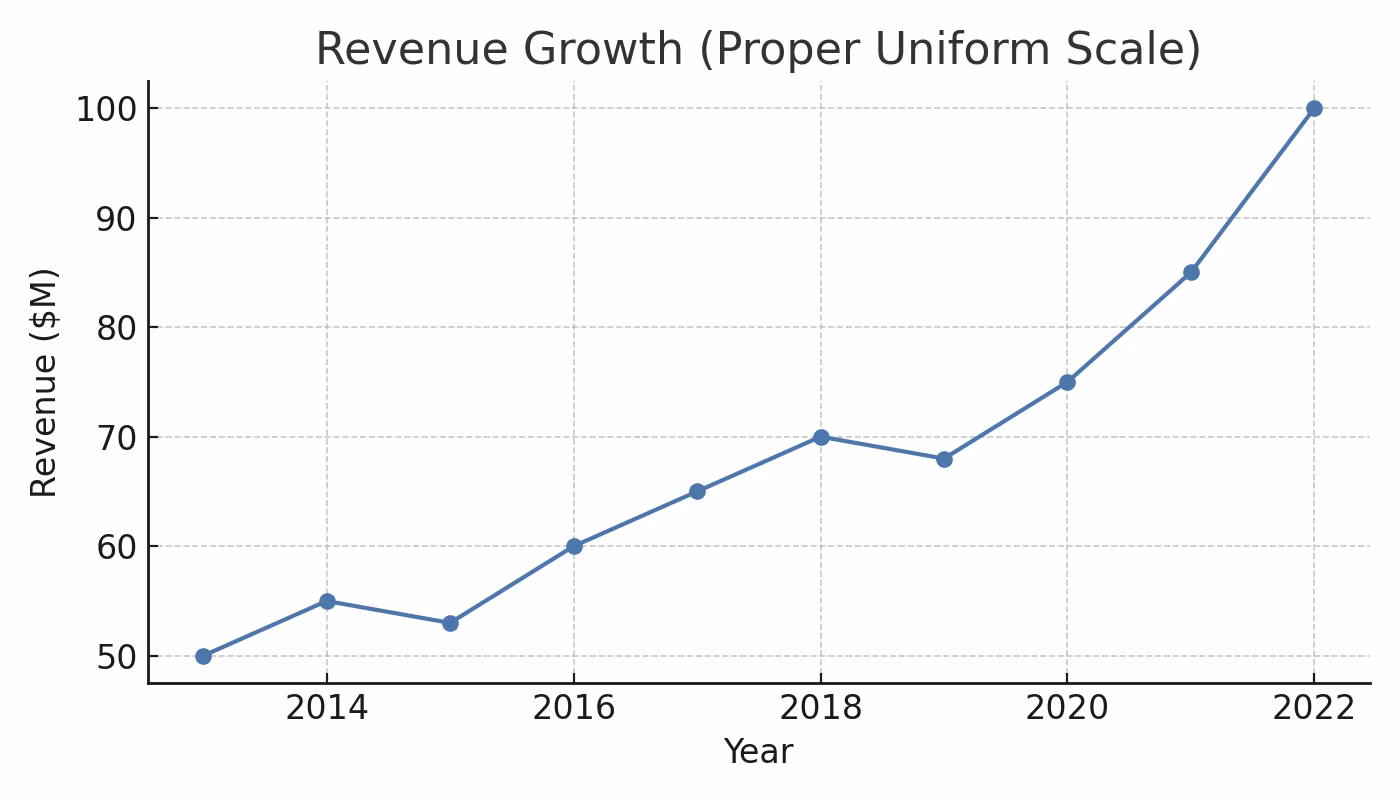
The general pattern still looks the same, but the overall picture is not as clean as the one the original graph represents. The unevenly plotted data points in the first graph skip years to make revenue look like a straight, consistent upward trend.
Example Scenario: A consultant is presenting their “before vs. after” to demonstrate the ROI they’ve brought to your company. Their “before” period is stretched evenly over several years, while their “after” period uses select quarters plotted at irregular intervals to show an outsize spike in performance. That’s critical context to understand, especially if you have doubts about the value they’re generating.
💡 Tip: Be deliberate with spacing and scale. Even small choices can dramatically change how your data is understood.
Incomplete or Incorrect Labels
One final big red flag: Graphs with any kind of unlabeled data, or labels that don’t make sense. Here’s a simple example:
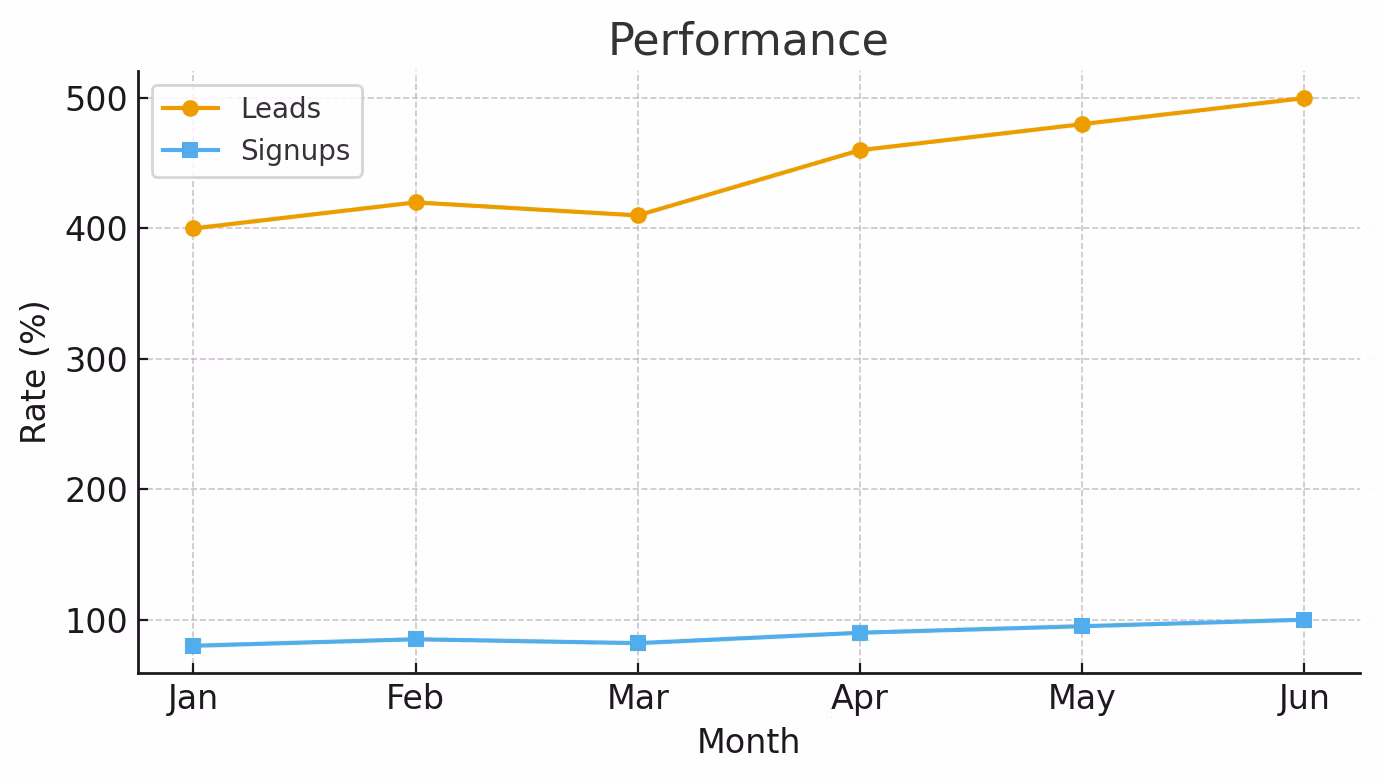
What’s wrong here? The biggest problem is that the Y-axis is labeled “Rate” and has a percent sign. But there’s no percentages here; both statistics are counts. “Performance” is also a vague title that tells you very little useful information about what’s on the graph.
On top of that, there’s no indication that signups are calculated as a percentage of leads (which they usually are). But there’s nothing here to indicate that relationship. Plus, there’s no source listed for the data, so it’s hard to fact-check.
Here’s a graph that uses a more appropriate format and more informative labeling for the same data:
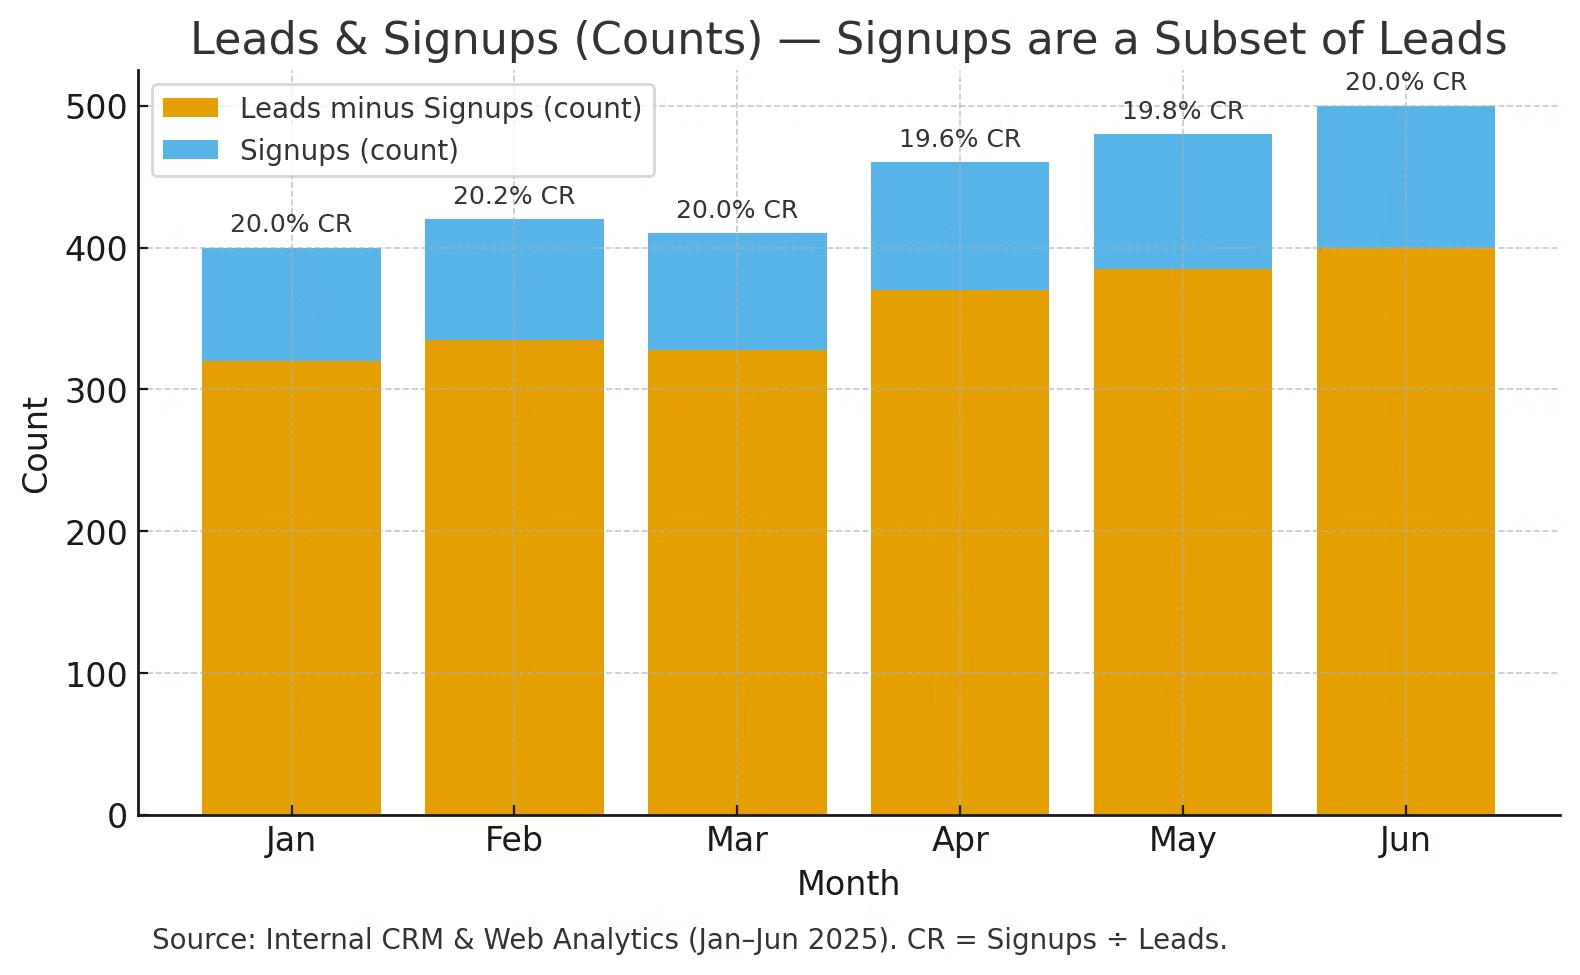
First, a bar chart makes it easier to visualize signups as a subset of percentages. Everything is clearly explained and labeled via a legend, and there’s a source for the data listed at the bottom. The Y-axis has been correctly labeled as a count rather than a percentage, and intervals are properly labeled. Finally, next to the source, the denominator for the conversion rate is listed: Signups divided by leads.
Example Scenario: If you’re a SaaS executive closely monitoring customer churn through data dashboards, it’s vital to know whether you’re looking at customer churn or revenue churn. Customer churn measures the rate at which you retain customers, while revenue churn measures the rate at which you retain revenue. If you’ve successfully upsold a few existing customers to a higher package recently, a low revenue churn rate could be hiding a problem with customer churn that you urgently need to address.
💡 Tip: Label every axis, unit, and data point clearly—don’t assume your audience will infer meaning.
How to Spot a Misleading Graph: A Checklist
Now that we’ve looked at some examples, let’s run through a quick checklist that you can use to spot and flag misleading visualizations.
Source
Was the data self-reported or collected in a reputable, independent study?
Does the graph show the date range? Is it recent enough to support the claim?
Is there a link, citation, or another way to look at the source’s methodology?
Chart Type & Design
Is the type of chart a good choice for the metric (such as a line graph for a trend)?
Are slices and buckets comparable in width and grouping?
Could you tell the story more clearly with a simpler chart?
Axes & Scale
Does the Y-axis start at zero for a bar chart? If not, is there a clear reason?
Are X-axis intervals uniform?
If two different scales are being compared, are they normalized?
Full Data / Timeframe
Is this the complete relevant period? Have any relevant periods been omitted?
Do comparisons use comparable timing periods?
Is seasonality handled appropriately, such as noting the difference between YoY and MoM where it matters?
Labels & Context
Do titles, axes, legends, and units labeled have useful and logical labels?
Are metrics defined, and are they relevant?
Are units like currency and measurement units adjusted for geography?
💡 Need a faster way to go from raw data to clear, trustworthy visuals? Learn more about Analyst Studio.
Best Practices to Avoid Misleading Charts and Graphs
It’s just as important to avoid misleading graphs in your own work—especially when building native visualizations for others to explore—as it is to spot them in others.
Here are some tips for keeping your graphs clean, accurate, and readable to the people with whom you’re communicating:
Label everything clearly: Pay attention to units like currency, and always define the denominator in rates—for example, “Conversion Rate = Orders/Sessions.”
Show the most relevant change: Use absolute change (like +$600K) when scale matters, and relative change (like +12%) to show proportional impact. Include both when helpful.
Start with trustworthy data: If your data source is questionable, prioritize cleanup and data governance before building any visuals.
Pick the right chart type: Try out different types of charts and graphs, and choose the one that best supports your message and makes insights easy to understand.
Use AI tools to explore different views: With AI agents like Spotter, you can ask questions in plain language, test multiple chart types, and find the clearest way to present your insight.
Keep visuals clean and accessible: Skip 3D effects, busy gradients, or cluttered designs, and stick to WCAG standards for charts and graphs.
Take control of your data story and avoid misleading graphs
Ultimately, using data is all about communication: clear, honest, and with all the necessary context. With ThoughtSpot, anyone with permission can jump right into your cloud-based data workstream to start creating dashboards and workshopping visualizations with their team.
Sign up for your free trial of ThoughtSpot now and start building a whole new way to work with data.


