- A horizontal bar graph compares one numeric measure across discrete categories, with labels on the vertical axis and values on the horizontal axis.
- Horizontal bars are a strong choice for long category labels, ranked lists, survey responses, and other comparisons where label readability matters.
- For a conventional bar chart, start the value axis at zero because bar length represents magnitude.
- Sort nominal categories by value, but keep a natural sequence for age bands, ordered survey responses, or time.
- Use color with purpose, and add labels or another visible cue whenever color carries meaning.
A horizontal bar graph makes category comparisons easy to scan, especially when labels are long or the order itself tells a story. You place categories down the vertical axis, plot values across the horizontal axis, and size each bar to match its value.
Choose this chart when you want readers to compare one measure across discrete groups. You will learn when horizontal bars fit, how to create them, and which design choices help readers find the point quickly.
What Is a Horizontal Bar Graph?
A horizontal bar chart compares a quantitative value across discrete categories. The bars extend from left to right, and their lengths represent the measured values.
In the conventional layout, category labels sit on the y-axis, while the numeric scale runs along the x-axis. The ONS guidance on axes and gridlines puts discrete categories on the vertical axis and recommends starting a bar chart’s value axis at zero.
This guide uses the term ‘horizontal bar chart’ throughout. For example, list support issue types vertically and use bar length to show the request count for each type. No invented results are needed.
When Should You Use a Horizontal Bar Graph?
Use a horizontal bar graph when your main question compares one measure across categories. Long labels fit naturally beside the bars, and value-based ordering can make a ranking apparent without asking readers to decode rotated text.
The Government Analysis Function notes in its Government Analysis Function bar-chart guidance that bar charts can show data ranked in ascending or descending order. Still, orientation should follow the question rather than a blanket preference.
| Question or constraint | Better starting point | Why |
|---|---|---|
| Do long category labels or ranking matter most? | Horizontal bars | Labels remain readable, and ordering is easy to scan. |
| Is time the main organizing dimension? | Vertical columns | Use vertical columns for a time-series bar display, following [ONS bar-chart guidance](https://service-manual.ons.gov.uk/data-visualisation/chart-types/bar-charts). |
| Are you comparing several time series? | Line chart | When comparing more than one time series, use a line chart. |
Use Horizontal Bars for Readable Labels and Rankings
Horizontal bars give category labels room to remain horizontal, so readers avoid angled or heavily abbreviated text. That makes the format practical for categories with uneven label lengths.
When categories have no inherent sequence, sort them by value so the ranking becomes part of the display. The ONS guidance on ordering categories recommends value sorting, while retaining the usual order for age groups or income bands.
Natural order takes priority when sequence carries meaning. Keep age bands, response scales from “strongly disagree” to “strongly agree,” and time periods in their expected order rather than rearranging them by value.
Choose Another Chart When the Question Changes
A horizontal bar chart is not the default when the question is about change across several time series. In that case, use a line chart.
If a zero baseline hides the differences you need to discuss, use a mark that does not encode magnitude through filled length. A dot plot is one option. When labels, legends, or several series crowd the view, consider filtering, grouping, or splitting the comparison.
Which Horizontal Bar Graph Variant Fits the Question?
Practitioner guidance: select a simple, grouped, or stacked horizontal view based on the question. Consider a simple view for one measure, a grouped view for multiple series, or a stacked view for composition.
Practitioner guidance: test the selected view for legibility. Avoid adding series or segments that make the comparison hard to read.
How to Create a Horizontal Bar Graph
The following steps are practical, tool-agnostic guidance rather than a universal technical standard. They give you a repeatable way to connect the chart to a clear comparison question.
Define the question the chart must answer.
Choose discrete categories and one clearly defined numeric measure.
Set the aggregation, such as count, sum, or average.
Inspect missing values, duplicate records, and unexpected category names.
Select a horizontal bar chart and sort the categories intentionally.
Add a descriptive title, concise labels, and an explicit unit.
Check the completed chart against the original question.
ThoughtSpot Model supports governed data models, which can help keep a chart’s measure consistent across the views people use.
As a practical check, document what the metric includes, its aggregation, the reporting period, and how missing records are handled.
Start With the Comparison Question
Suppose you ask, “Which support issue type generated the most requests this month?” The category is issue type, the measure is request count, and the time boundary is the current month.
Next, decide what counts as one request and how repeated or reopened records should be treated. Those choices belong in your practical data-preparation check because a clear chart cannot correct an unclear measure.
Once the measure is settled, sort nominal issue types by request count so the ranking answers the question directly. Do not invent or fill in counts simply to complete the example.
Build the Chart, Then Check the Readout
After creating the bars, write a title that states the comparison or main pattern. Do not simply name the chart type. Add concise labels, identify the unit, and start the numeric axis at zero.
Value labels are optional. Government Analysis Function bar-chart label guidance says labels can help, but they can also add visual clutter. Use them when exact values matter and the text remains legible.
Finally, read the chart as a first-time viewer would. Can you identify the measure, unit, period, ordering logic, and main comparison without relying on background knowledge?
How To Design a Horizontal Bar Graph Readers Can Scan
Good design keeps attention on the comparison rather than the chart mechanics. The choices below offer practical guidance grounded in established visualization and accessibility principles.
| Choice | Practical check | Watch for |
|---|---|---|
| Zero baseline | For conventional bar charts, keep the value axis at zero. | Consider another chart if zero hides the needed comparison. |
| Value sorting | Sort nominal categories by value unless the sequence is meaningful. | Preserve age bands, response scales, and time order. |
| One primary color | Use one main color for a single series, following [ONS guidance on chart colors](https://service-manual.ons.gov.uk/data-visualisation/colours/using-colours-in-charts). | Check that added colors do not impede comparison. |
| One accent color | Use an accent only to call out a focal category. | Pair the accent with a label or annotation. |
| Value labels | Add values only when they remain legible. | Remove labels if they crowd the bars. |
| Descriptive title | Use [ONS guidance on chart text](https://service-manual.ons.gov.uk/data-visualisation/guidance/chart-text) to write a title that states the comparison. | Keep the wording concise and specific. |
Remove borders, icons, gradients, and gridlines that do not help answer the question. A restrained chart can still include context, but every element should support identification, comparison, or interpretation.
Color should never carry the full burden of meaning. The World Wide Web Consortium’s W3C guidance on use of color says color should not be the only visual means of conveying information. Pair meaningful color with text, position, pattern, or another visible cue.
Use a Horizontal Bar Graph to Explore a Ranking
A ranking chart often answers the first question, then prompts another. Which product leads overall, does the order change by region, and what happens when you switch the period?
Consider an illustrative dashboard with products ranked by sales. What changes when you apply a natural-language filter for a saved region preference, then ask about the period? This path does not prove that interaction improves decisions or comprehension.
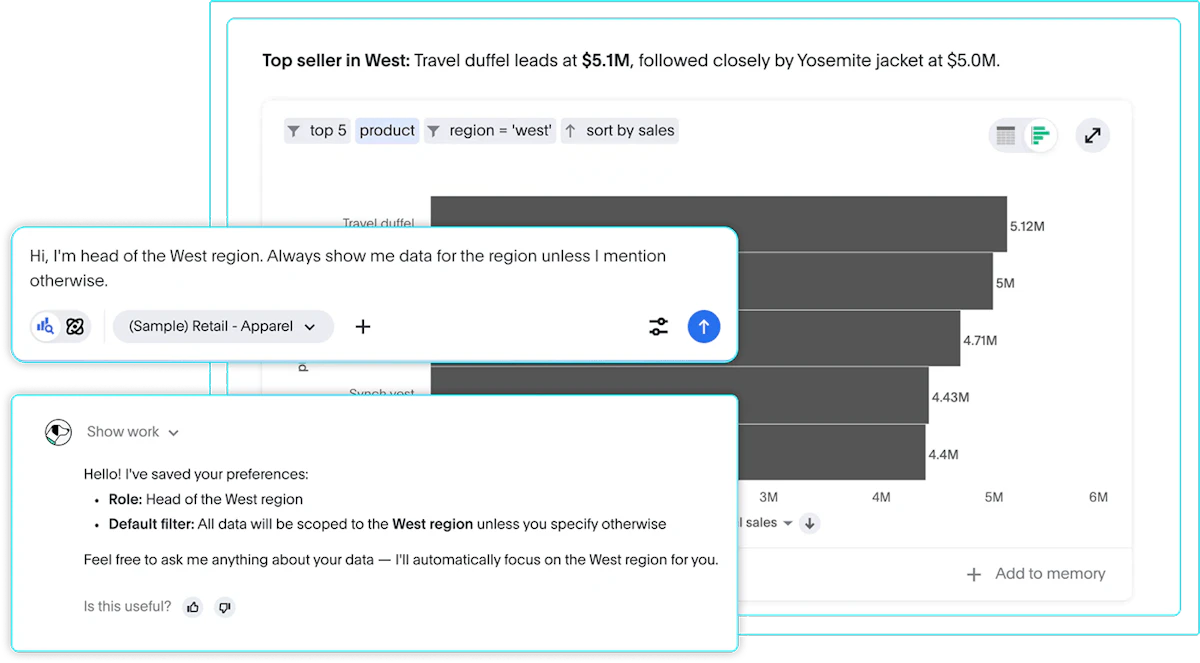
ThoughtSpot Liveboards support interactive dashboards with interactive, drillable visualizations. A horizontal bar chart can serve as one ranking view within that exploration. What changes when you filter the data or ask a follow-up question?
Keep the Ranking Grounded in a Trusted Measure
Readable bars still depend on a measure that has a clear definition. Before you compare categories, confirm what the metric includes, which aggregation it uses, what period applies, and how missing records are handled.
A governed, reusable data model can keep that definition aligned across related views. A shared definition helps teams apply the same metric logic across related views.
Make the Comparison Easy to Read
Choose a horizontal bar graph when category comparison, long labels, or ranking is central to the reader’s question. Start the value axis at zero, sort with intent, and label the measure and unit. Use color as a supporting cue, not the only cue.
Once the ranking is clear, you can give readers appropriate ways to examine its context without promising a result from interaction alone. To explore how ThoughtSpot turns governed data into interactive visualizations, see ThoughtSpot in action.