- Start with the decision a SaaS dashboard must support, then select the few metrics that help its owner make that decision.
- Give each role a focused entry point instead of crowding every KPI into one view.
- Pair each metric with a comparison, target, or drill-down path, so you can understand what changed and why.
- Build on documented metric definitions and current data that people can question and inspect.
- Choose software that supports exploration after the first answer. A 2025 Implementation Science article, published by Springer Nature, offers human-centered dashboard guidance. It recommends human-centered methods to improve dashboard relevance and sustained use.
A SaaS dashboard is a focused, decision-ready view of subscription, product, customer, and operational data. For a broader foundation, start with what a dashboard is, then shape the view around a recurring decision.
The best SaaS dashboards help you spot a change, understand its likely drivers, and decide what to do next. Before arranging a single chart, name the decision, metrics, users, and data definitions that will make the view useful.
What a SaaS Dashboard Should Help You Decide
A broad report can document what happened across many parts of the business. A SaaS KPI dashboard has a narrower job: put a specific, recurring decision in front of the person responsible for making it.
For example, you may need to decide whether retention risk is rising, where new bookings are slowing, or whether a product release changed activation. When the question is clear, you can select the smallest set of evidence needed to answer it.
That focus separates a useful SaaS analytics dashboard from a screen filled with available data. One gives you an entry point for action; the other may leave you scanning for a signal without knowing what deserves attention.
Start by separating KPIs versus metrics. A metric records a value, while a KPI connects a value to a goal or decision that matters to your SaaS business.
Definitions come next because familiar labels can hide different calculations. Monthly recurring revenue may include or exclude discounts, service fees, paused subscriptions, or certain contract terms, depending on your documented policy.
If finance, sales, and customer success calculate the same label differently, the dashboard cannot settle the discussion. A shared definition gives every viewer a consistent starting point, while the underlying detail provides a path for checking the calculation.
A decision-ready dashboard should clarify what changed, the relevant comparison, and where to look next. Can the view support those questions? If not, revise the scope before adding more visual elements.
Choose SaaS Metrics by Decision and Role
You rarely need every available SaaS metric in one place. Work backward from the decision, then choose the indicators that describe the outcome, its direction, and the factors most likely to explain movement.
Recurring revenue decisions may call for monthly recurring revenue (MRR), annual recurring revenue (ARR), expansion, contraction, and churn. Because MRR and ARR shape planning and reporting, their calculations should follow your organization’s documented revenue definitions.
Acquisition decisions often need customer acquisition cost (CAC), conversion rates, and a clear view of the funnel stage under review. You can find useful framing in these marketing KPI examples, but the final selection should match your channel mix and operating model.
For product adoption, activation, engagement, and feature usage can show whether people reach meaningful value and return. Customer health views may combine retention, support activity, and renewal risk, depending on the decision a customer success leader must make.
Roles need different starting points because their decisions differ. An executive may watch company-level movement, while a product manager needs behavior around a release, workflow, or cohort.
| Role | Decision | Example Metrics |
|---|---|---|
| Executive | Where does performance need attention? | ARR, growth, retention, and CAC |
| Product manager | Did a release change adoption? | Activation, engagement, and feature usage |
| Customer success leader | Which accounts need review? | Retention, support activity, and renewal risk |
| Operator | What changed in the current workflow? | Conversion, volume, cycle time, and exceptions |
These entry points can share governed definitions without sharing the same layout. For a closer look at leadership views, review executive dashboard metrics and adapt the categories to the decisions your leaders actually own.
Avoid turning role-based design into a maze of isolated dashboards. When two roles need the same metric, keep the definition consistent, then adjust the comparison, supporting detail, and follow-up path for each workflow.
How do you know when the metric set is complete? Ask whether each item changes a decision or explains another metric; if it does neither, it probably belongs in a deeper detail view.
Design a SaaS Dashboard for Fast, Confident Reading
Good SaaS dashboard design makes the primary question obvious before someone studies the details. Use visual hierarchy to place the main KPI, trend, or decision signal first, then organize supporting context around it.
Give each view one primary question. A revenue view can explain recurring revenue movement, while a product view can focus on activation after a release. Giving both equal weight makes the reading path harder to follow.
Context helps you interpret movement. Add a relevant comparison period, target, threshold, or benchmark. Use descriptive titles that explain the view instead of naming a generic chart type.
Color should direct attention, not decorate every tile. Reserve stronger contrast for exceptions, material changes, or selected states. Keep the remaining palette restrained, so labels and patterns stay readable.
Layout also affects how people scan information. In the 2025 IEEE dashboard study, researchers collected eye-movement data from 60 participants, each viewing 36 dashboards, to study how dashboard layout shapes viewing behavior.
That study supports careful attention to arrangement within its research setting, without proving one universal layout for every dashboard. Your best test is still whether intended users can find the main signal, interpret it, and reach the supporting detail without extra explanation.
Progressive disclosure keeps the initial view readable. Show the summary first, then provide filters, drill-down, or linked detail for people who need to inspect a region, plan, account, segment, or cohort.
When is a table clearer than a chart? Use a compact table when readers need exact values across a limited set of rows or must compare several attributes side by side.
Use a chart when position, shape, or change over time carries the meaning. A line chart makes trends easier to scan. A bar chart supports direct comparison across a few categories.
For additional patterns, use these dashboard design best practices as a review checklist. Keep only the choices that help your audience read the signal and continue the analysis.
Build Your SaaS Dashboard in Five Steps
A solid build process starts before you connect data or choose a visualization. Use these five steps to keep the SaaS dashboard tied to a real workflow.
Name the decision and owner. Write down the recurring decision, who makes it, how often it occurs, and what action may follow.
Define the metric and comparison. Document the calculation, source, time grain, filters, and comparison that give the number meaning.
Connect and model the source data. Bring the required subscription, product, customer, or operational data into a governed model with consistent joins and business definitions.
Build the initial view for the user’s workflow. Put the primary signal first, add only the context needed to interpret it, and provide a direct route to supporting detail.
Test follow-up exploration. Give the view to its intended users and see whether they can investigate a change without filing a new request for every question.
That final test matters because a dashboard often raises a better question than the one you started with. If churn rises, you may want to compare plan, tenure, account size, product usage, or support history without waiting for another report.
ThoughtSpot interactive Liveboards support real-time analysis and drill-down from the initial view. The ThoughtSpot Agentic Analytics Platform provides a conversational interface for exploring business data and getting immediate answers.
Adoption still depends on the people, process, and data behind the experience.
Before launch, watch a few users work through a real scenario. Where do they pause, which labels prompt questions, and what detail do they request next? Their behavior will tell you more than a final design review alone.
Turn SaaS Revenue Reporting into a Starting Point
Recurring-revenue reporting shows how this approach works in practice. Start with total ARR or MRR movement, then break the change into new business, expansion, contraction, and churn, using the definitions your organization has approved.
A single total tells you the result, but the movement categories help explain the path. From there, let users inspect segment, plan, region, or cohort drivers, so they can see where the change began and which factors deserve review.
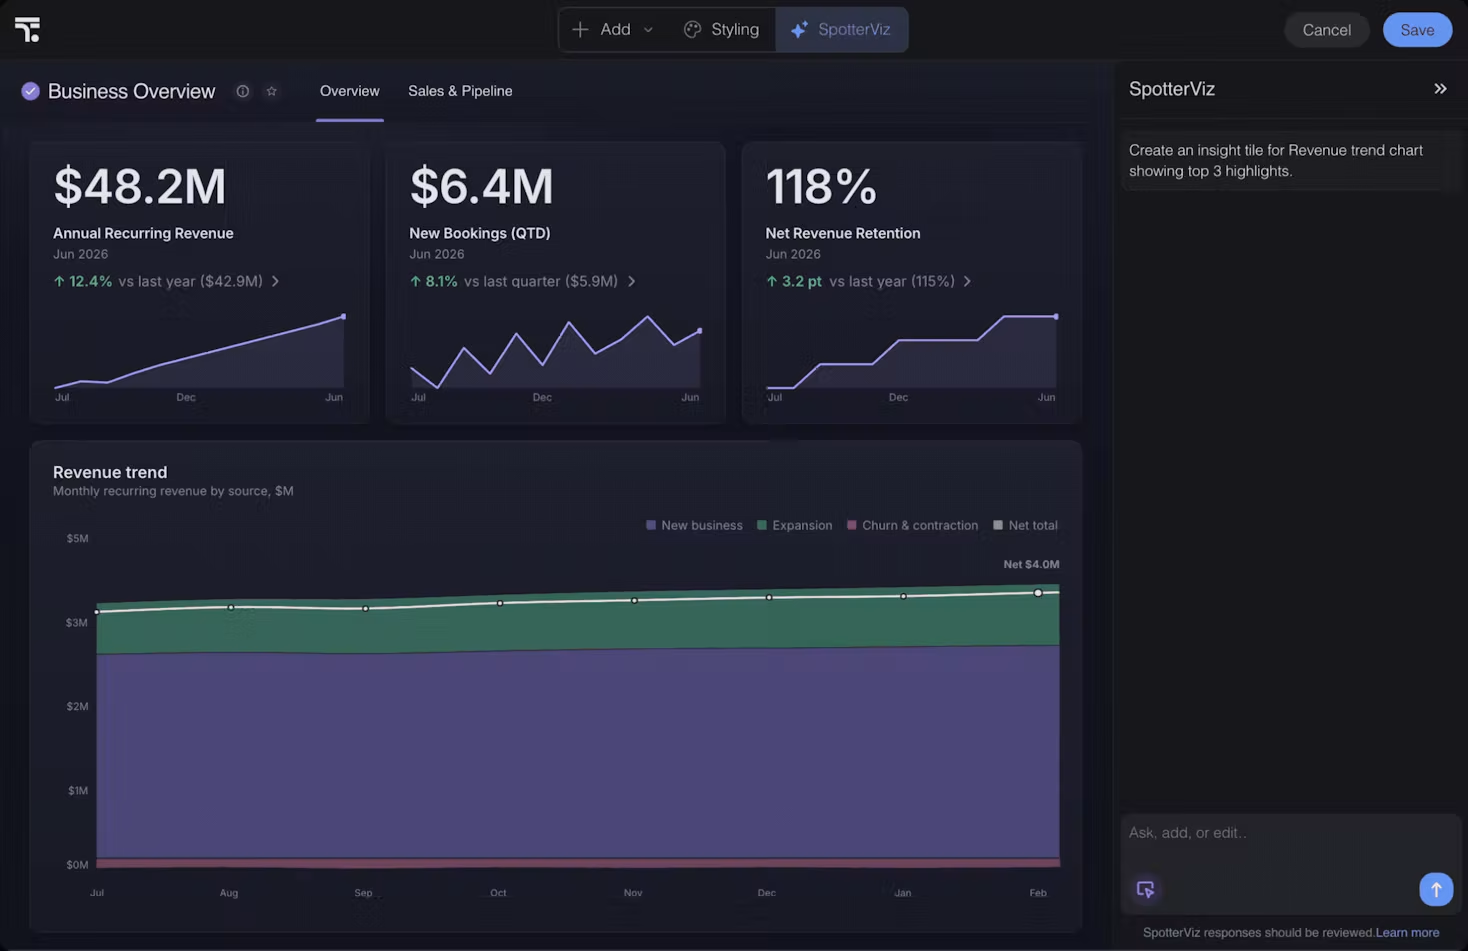
Treat the displayed figures as illustrative, not as real business results. Focus on the structure: headline metrics, a revenue trend, and a prompt for further analysis appear in the same workflow.
An AI dashboard builder can help shape the starting view, but the explanation still needs trusted metric definitions and inspectable detail. When an AI-assisted summary points to a driver, you should be able to check the source data, filters, and logic behind that conclusion.
This approach turns a revenue dashboard into a working analysis surface. You see the initial number, ask what drove it, and move into the relevant slice without losing the governed definition that anchored the first view.
Build a Dashboard That Leads to the Next Question
Useful SaaS dashboards focus on a decision instead of displaying every metric you can collect. They give each role the right starting point, add enough context to interpret change, and keep trusted follow-up exploration close to the signal.
As you review SaaS dashboard software, ask one question: Can you move from a changed KPI to its details while keeping definitions consistent? To see how ThoughtSpot approaches that workflow, you can request a demo.