


Most organizations can't access their HR data quickly enough to act on emerging problems. Consider a common scenario: Engineering turnover jumped 20% last year. Your HR team needs to extract data from multiple systems, reconcile the numbers, and build a custom report. By the time you understand what’s happening, similar patterns have already emerged in another department, and your best performers are interviewing elsewhere.
Often, collecting more data isn’t the most effective solution to these problems. Instead, it’s about making your existing HR metrics accessible and actionable. This guide covers the 12 most important HR KPIs to track, how to build dashboards that drive decisions, and how modern analytics platforms help you move from reactive reporting to proactive workforce management.
What are HR metrics and HR KPIs?
HR metrics are data points that show you how effective your HR efforts are, like how quickly you're able to onboard new people or how engaged your employees feel. Human resources key performance indicators (HR KPIs) are the most important subset of these metrics, the ones directly tied to your business goals and strategic objectives.
While all KPIs are metrics (as we discuss in our article on KPIs vs metrics), not all metrics qualify as KPIs. HR metrics give you a complete view of all your people-related activities, while KPIs tell you if you're hitting the specific targets that move your business forward.
12 human resources key performance indicators you should track
These human resources KPI examples are foundational tools for measuring and managing your workforce sustainably.
Start Getting Better Insights
1. Employee turnover rate
This metric calculates the percentage of employees who leave your organization over a specific time period. High turnover often signals problems with management, compensation, or career development opportunities.
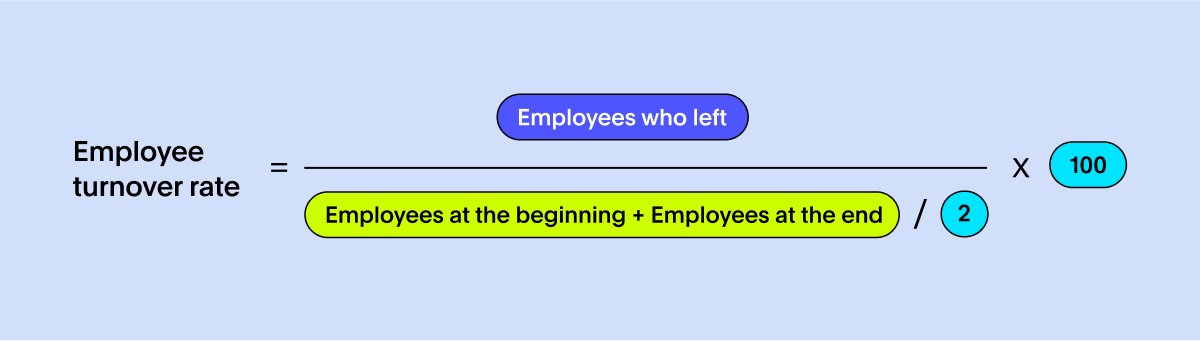
Why it matters: Replacing employees costs time and money, from recruiting expenses to lost productivity while new hires get up to speed.
Dashboard tip: Track voluntary versus involuntary turnover separately and filter by department to spot problem areas before they spread.
2. Time to hire
Time to hire measures the days between when a candidate applies and when they accept your offer. It reflects how efficiently your recruiting process moves qualified candidates through your pipeline.
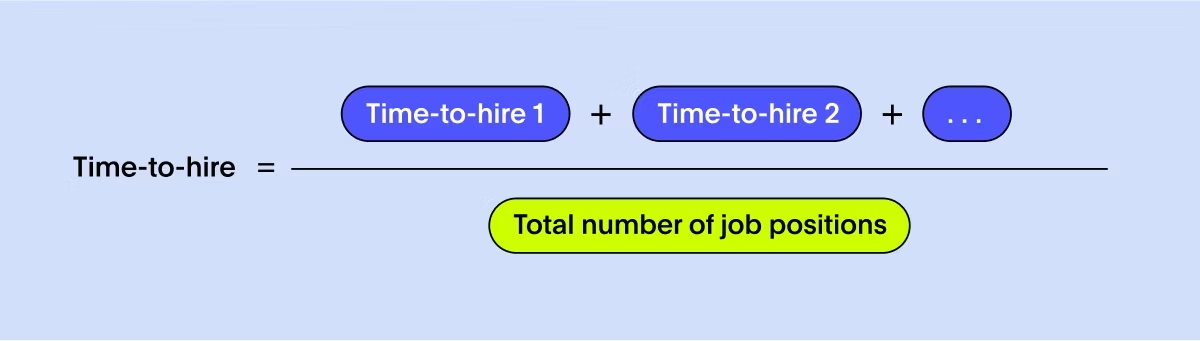
Why it matters: Long hiring cycles frustrate candidates, potentially causing you to lose top talent to competitors and leave important roles unfilled longer.
Dashboard tip: Compare time to hire across different roles and departments to identify bottlenecks in your process.
3. Cost per hire
This KPI calculates your total investment in finding and hiring each new employee, including recruiter salaries, job board fees, and agency costs.
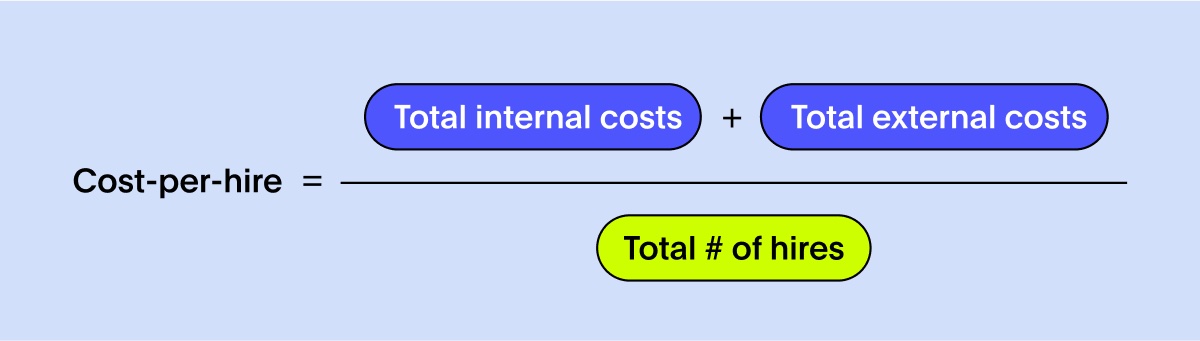
Why it matters: Understanding your hiring costs helps you allocate your recruiting budget more effectively and choose new hiring tools that deliver the best value.
Dashboard tip: Break down costs by sourcing channel (referrals, agencies, job boards) to see which deliver the best return on investment.
4. Employee satisfaction
Typically measured through surveys like Net Promoter Score (eNPS), this metric gauges how likely your employees are to recommend your company as a workplace.
Why it matters: When your employees are satisfied, they stay longer, perform better, and help you build a positive culture that attracts more great talent.
Dashboard tip: Segment satisfaction scores by manager and department to identify both high-performing leaders and areas needing attention.
5. Employee productivity
Productivity measures your workforce's output relative to input. The calculation varies by industry—you might track revenue per employee, units produced per hour, or projects completed per quarter.
Why it matters: Tracking productivity helps you see how efficient your teams are and understand the impact of new tools, training, or process changes.
Dashboard tip: Display productivity trends alongside engagement scores to identify correlations between employee satisfaction and performance.
6. Training and development ROI
This KPI compares your training program costs against measurable benefits like increased sales performance, reduced error rates, or faster project completion. A simplified calculation formula involves dividing the net financial value of improvements by your total training investment, then multiplying by 100 to get a percentage return.
Why it matters: Positive training ROI proves your learning programs build valuable skills and contribute to business results.
Dashboard tip: Track performance metrics for trained groups against control groups to isolate training impact from other factors.
7. Absenteeism rate
Absenteeism measures the frequency of unscheduled employee absences due to illness, personal issues, or other reasons.
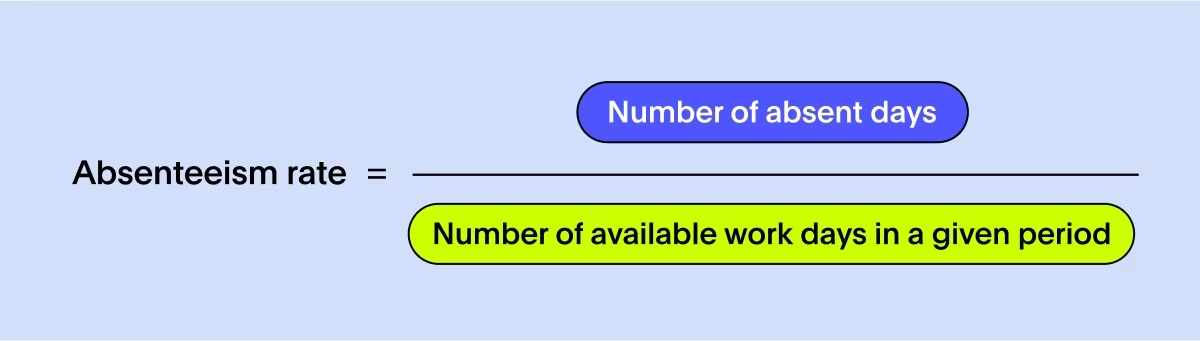
Why it matters: Rising absenteeism often points to employee burnout, low morale, or disengagement, which are all early warning signs of higher turnover. It can also signal a need to reevaluate benefits or provide other HR interventions to support employees’ health and work-life balance.
Dashboard tip: Monitor absenteeism patterns by team and compare them to company averages to catch concerning trends early.
8. Diversity, equity, and inclusion
DEI metrics show you how well you're building an inclusive workplace across different demographic groups. You might track things like diversity in leadership roles, whether you're paying people fairly across groups, and who's getting promoted. These numbers help you spot where representation falls short and make sure everyone gets a fair shot.
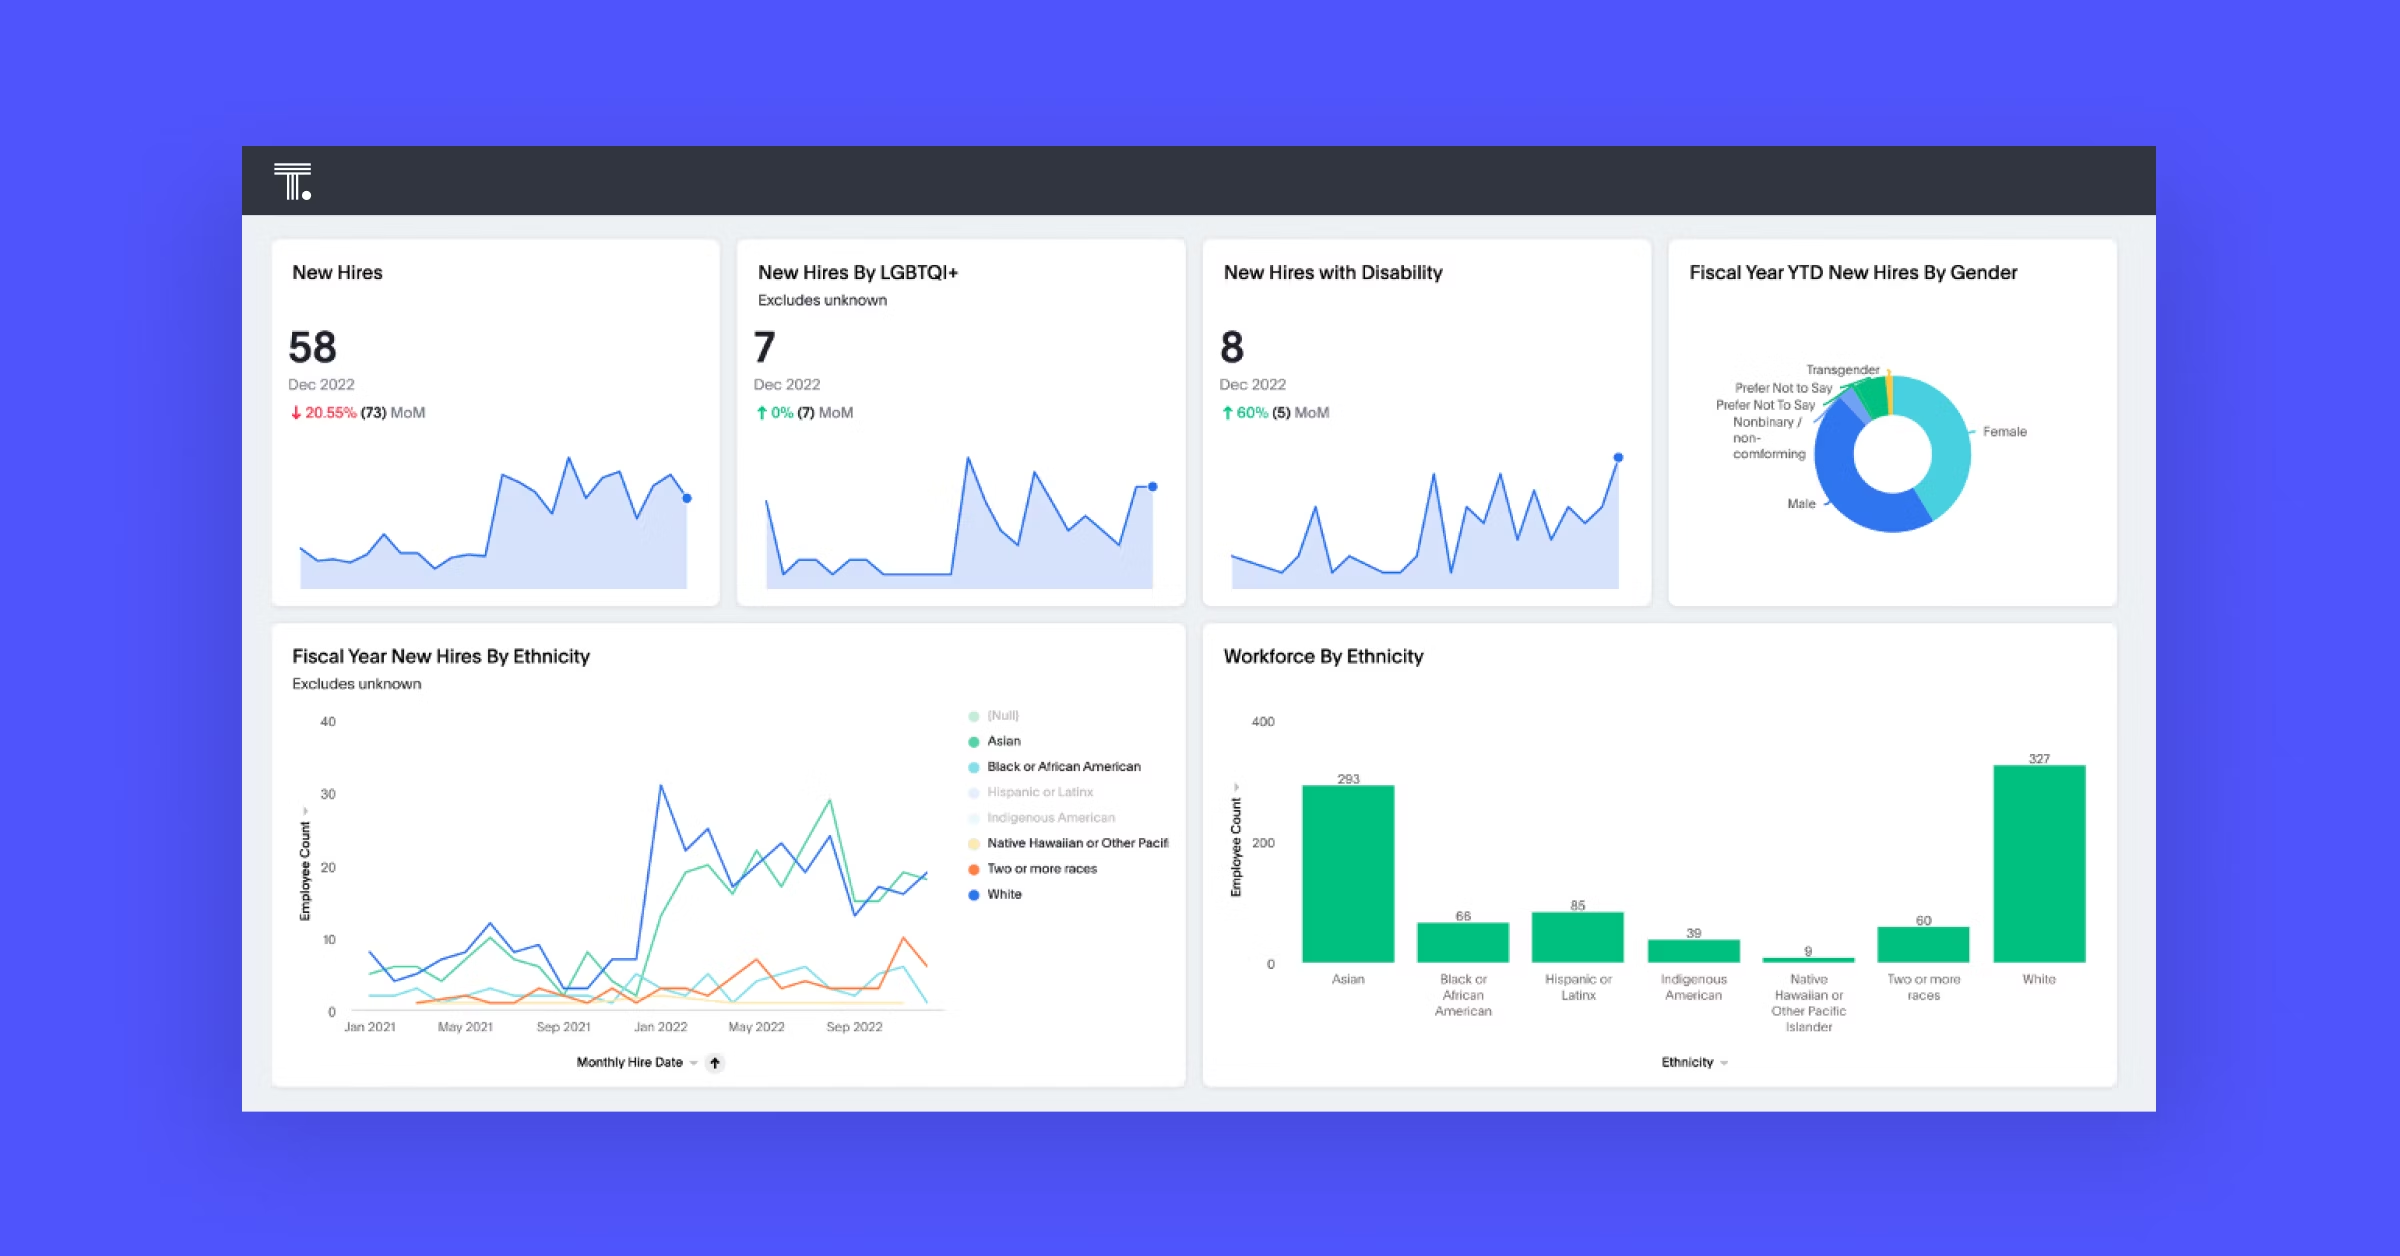
Why it matters: Diverse teams bring different perspectives that lead to better problem-solving and innovation. Tracking DEI metrics helps you build a more inclusive workplace and strengthen your employer brand.
Dashboard tip: Use secure, role-based access controls to explore representation data while maintaining strict privacy protections.
9. Employee engagement
Engagement measures employees' emotional commitment to their work and organization. Your organization might assess these factors through pulse surveys about motivation, recognition, and belonging.
Why it matters: When your employees are engaged, they deliver better customer service, are more productive, and are less likely to leave.
Dashboard tip: Correlate engagement survey results with performance and retention data to quantify engagement's business impact.
10. Performance rating
This metric analyzes how performance ratings are spread across your organization. The purpose is to assess whether your performance management system effectively identifies top talent and addresses underperformance.
Why it matters: Unbalanced distributions, like having too many ratings clustered at the extremes, might indicate manager bias, unclear expectations, or grade inflation.
Dashboard tip: Use bar charts to compare rating distributions across managers and departments.
11. HR-to-employee ratio
This ratio compares your HR staff size to your total employee count. The output provides a benchmark for determining if your HR team is stretched too thin.
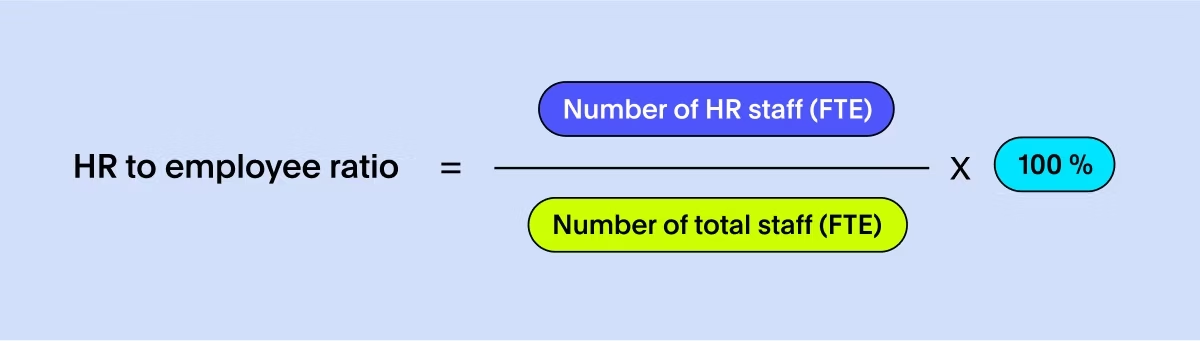
Why it matters: A very high ratio may indicate your HR team is carrying too much to help with bigger company goals beyond basic administrative tasks.
Dashboard tip: Compare your ratio to industry benchmarks to evaluate your HR staffing levels.
12. Revenue per employee
Revenue per employee divides your total company revenue by current headcount, offering a high-level view of organizational efficiency and productivity.
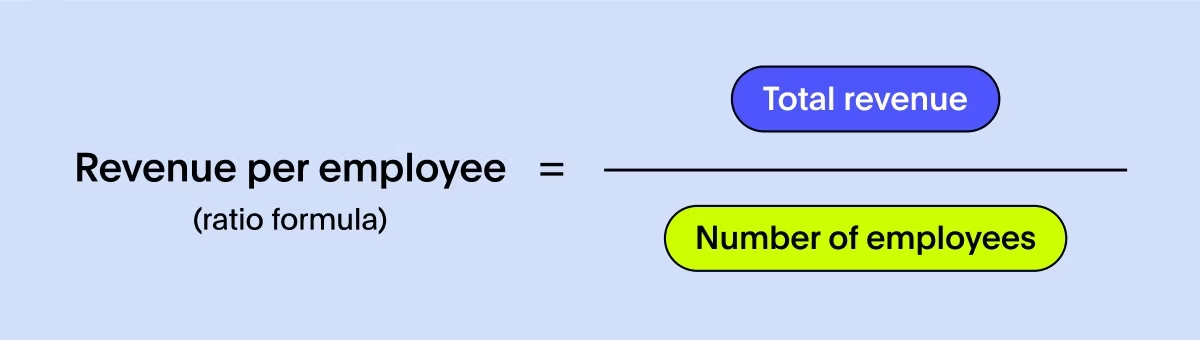
Why it matters: Growing revenue per employee suggests your organization is becoming more productive and scalable over time.
Dashboard tip: Track this metric both quarterly and annually to assess long-term efficiency trends and profitability improvements.
How to choose the right HR metrics for your needs
You don't need to track all 12 metrics immediately. The most effective approach focuses on human resources key performance indicators that align with your specific business goals and challenges.
Here's how to prioritize:
Start with business objectives: Identify your top three to five business priorities this year, whether that's accelerating growth, improving efficiency, or reducing attrition
Map relevant KPIs: For each business goal, select the people-related metrics that directly impact success
Verify data availability: Confirm you have reliable, clean data for your chosen KPIs before building dashboards
Design for decision-making: Structure your HR KPI dashboard around the questions you need to answer, not just the data you have available
One final consideration: data quality matters. As Dr. Serena Huang, Global Head of People Analytics at Kraft Heinz Company, noted in an episode on The Data Chief podcast,
"People data is very messy. We have to pay attention to data quality before you can make useful analytics. Or at least in parallel, address some of the data quality issues as you go. Standardizing processes so that you are talking about the definition of a human capital metric the same way [is a] journey we’ve been on for a long time, and focusing on data quality has paid off for us."
What's more, because HR data often lives in unstructured formats—like performance review notes, exit interview transcripts, or employee feedback—you may need to invest in platforms that can work with unstructured data alongside your traditional HR systems.
Move beyond static HR reporting with AI-powered analytics
The future of HR analytics isn't clicking through pre-built HR dashboards. It's about having natural conversations with your workforce data.
With ThoughtSpot Analytics, you can ask questions in natural language and get instant answers. Type "Why was engineering turnover high last quarter?" and Spotter, your team of AI Analysts, delivers analysis with actionable insights—no waiting for reports, no technical barriers. Unlike traditional BI tools that trap you in pre-built dashboards, ThoughtSpot's search-driven approach gives you the freedom to explore HR data with enterprise-grade security built in.
When you track the right human resources KPIs on an interactive dashboard, you can build a more engaged, productive workforce. See how easy it is to get instant answers from your people data when you start your free trial today.
HR metrics frequently asked questions
1. How many HR metrics should you include on one hr kpi dashboard?
Start with three to five core KPIs on a single dashboard to maintain focus and clarity. You can expand as your analytics maturity grows, but as a rule of thumb, avoid exceeding eight metrics on one view. Too many data points create visual clutter and make it harder to spot the insights that drive decisions.
2. How often should you refresh and review your human resources key performance indicators?
A live dashboard should provide data from a source that’s as close to a live feed as possible, while strategic KPIs need monthly or quarterly leadership reviews, and operational metrics require weekly or daily monitoring by frontline managers.
3. Which HR metrics work best for small teams just starting with people analytics?
Focus on foundational metrics like employee turnover rate, time to hire, and employee satisfaction (eNPS) if you're just beginning. These provide strong workforce health baselines without requiring complex data collection systems.


