- Digital business analytics combines data from digital interactions and core operations to answer questions tied to a business decision.
- A practical framework moves through four question types: what happened, why it happened, what may happen, and what action to consider.
- Trusted analysis depends on clear metric definitions, reliable data, appropriate access, visible lineage, and named ownership.
- You can start with one recurring decision, a small set of KPIs, validated data, and a limited first audience.
- Interactive dashboards and AI-assisted analysis help people investigate signals, ask follow-up questions, and bring evidence into daily work.
You know the frustration: a decision is waiting, the report is late, and two teams have different numbers for the same metric. Digital business analytics gives you a practical way to close that gap. In this article, the phrase means using data from digital interactions and core business operations to answer decision-relevant questions.
That definition is an editorial working term, not a formal standard. Its value comes from the approach: start with a decision, connect the right data, and agree on meaning. Then make the insight usable in the flow of work.
What Digital Business Analytics Means
Digital business analytics brings together signals from websites, apps, campaigns, products, customer activity, finance, and operations. You use that combined view to understand performance and decide what deserves attention next.
The word “digital” can cause confusion because nearly every business process now produces digital data. Here, it refers to the combination of digital-interaction data with the operational context needed to interpret it. A conversion rate becomes more useful when you can relate it to product usage, customer segments, revenue, service costs, or inventory.
The decision focus matters. Collecting more events, building more reports, or adding another model does not automatically improve a choice. A useful analysis connects a business question to agreed measures, relevant context, and a realistic action.
Digital.gov provides a narrower web analytics definition: “Web analytics are the collection, analysis, and reporting of website metrics and data.” Digital business analytics may include that evidence, but its scope extends into the rest of the business.
| Practice | Typical Scope | Example Question | Primary Value |
|---|---|---|---|
| Digital business analytics | Digital interactions plus core business operations | Which customer behavior signals should change our retention plan? | Connects signals to a business decision |
| Web analytics | Website and digital-service metrics | Which landing page has the highest completion rate? | Improves understanding of a digital experience |
| Business intelligence | Reporting, exploration, modeling, governance, and related analysis | How is revenue tracking against plan by region? | Creates a shared view of business performance |
| General data analytics | Broad methods applied across many data types and domains | Which variables are associated with an outcome? | Finds patterns, tests ideas, and supports many kinds of inquiry |
How It Differs From Adjacent Practices
These practices overlap, and most organizations use several at once. Web analytics can provide behavioral signals, while business intelligence can supply governed metrics and operational context. General data analytics contributes methods for describing patterns, testing relationships, and estimating future outcomes.
The distinction is mainly about the frame around the work. Digital business analytics starts with a decision that crosses digital and operational boundaries.
Instead of stopping at “checkout completion fell,” ask which segments changed and whether inventory or pricing played a role. Then consider what response fits the evidence.
Business intelligence also deserves a precise description. BI includes dashboards, but it can also include governed reporting, ad hoc exploration, semantic modeling, alerts, and other analytical workflows. Treating BI as a synonym for static dashboards hides the range of work that data and business teams already do.
Labels should help people coordinate, not create a new argument over vocabulary. If your teams share the question, metric definition, source, and decision owner, the exact category name becomes less important.
Build a Question-Led Analytics Framework
A useful analytics practice begins with questions rather than charts. Four question types can help you organize the work: what happened, why it happened, what may happen, and what action to consider.
This is a practical framework, not a universal taxonomy. Your team may use different labels, combine question types, or move among them as new evidence appears. The goal is to keep analysis connected to a decision while making uncertainty visible.
The U.S. Census Bureau’s industrial analytics study shows that multiple forms of analysis can coexist. In a 2021 survey of U.S. manufacturing establishments, 73% reported using at least one descriptive-analytics or statistics technology, while nearly 65% reported some predictive-analytics use.
Ask What Happened and Why
“What happened?” establishes the shared facts. You might examine revenue by week, activation by customer segment, campaign response by channel, or support volume by product area. Before discussing causes, confirm the time period, filters, population, calculation, and comparison point.
Then ask, “Why did it happen?” This question invites investigation rather than a quick story. If revenue fell, break the change into price, volume, product mix, region, customer type, and timing. When a segment stands out, look for contributing signals and check whether the data supports the explanation.
Suppose a product team sees a drop in trial conversion. The first view may show when the decline began, while the next questions examine acquisition source, device, onboarding step, account profile, and product usage. You are testing explanations, not searching for a chart that confirms the first hunch.
For business leaders who need to keep that investigation moving, natural-language business questions can provide a direct starting point. The source also describes making underlying query details and filters viewable, which helps you check what an answer includes.
Ask What May Happen and What Action to Consider
“What may happen?” shifts the discussion toward forecasts, likelihoods, and scenarios. You could estimate demand under several assumptions, flag accounts with elevated churn risk, or model how a pipeline may develop. Because predictions carry uncertainty, present ranges, assumptions, and known limits alongside the output.
A model can guide attention without declaring the future. If it assigns a higher risk score to a customer segment, inspect the drivers and review data quality. Then decide whether the signal is useful for the situation.
“What action should we consider?” adds business constraints and accountability. A recommendation might weigh expected impact, cost, customer experience, capacity, timing, and risk. Human judgment still matters because the best statistical option may not fit operational or ethical boundaries.
These questions rarely form a tidy conveyor belt. A recommended action can expose a missing definition, sending you back to the descriptive view. Likewise, an unexpected segment may lead to a new forecast or a revised decision.
Build a Trusted Data Foundation
Digital business analytics often spans customer, product, marketing, finance, and operations data. Each domain contributes context, but each can also use different identifiers, refresh schedules, access rules, and definitions.
That complexity makes trust a working requirement. If “active customer” means one thing in finance and another in product, a table join may still work technically.
Yet its business meaning remains unclear. You need shared definitions and visible ownership before the number can guide a high-stakes choice.
Developing NIST governance profile working material highlights data-quality standards, metadata, provenance, lineage, and analytics for data-driven decision-making. The material is still developing, so treat it as working guidance rather than a finalized mandatory standard.
Quality checks also need context. Digital.gov’s data verification guidance advises cross-checking multiple sources and verifying that data is complete, consistent, and standardized. For your team, that can mean comparing totals, testing joins, reviewing missing values, and confirming that a metric uses the intended population.
Connect Data Without Losing Business Meaning
Start with the relationships that matter to the decision. A customer identifier may connect marketing engagement, product use, support activity, contract details, and revenue. When that identifier changes across systems, document the matching logic and the records that cannot be joined confidently.
Next, define calculations where people can find and review them. A semantic model can give teams a common interpretation of metrics, dimensions, relationships, and access rules. However, a model still needs owners who can resolve disagreements and update definitions as the business changes.
Lineage adds another layer of practical context. It shows where a figure originated, which steps shaped it, and which downstream views depend on it. When a source changes or a result looks odd, lineage helps the right people investigate without starting from scratch.
A governed analytics workflow can bring preparation, modeling, analysis, and visualization into a connected process. The useful principle is broader than any product: keep the path from raw data to business meaning reviewable.
Access belongs in the design from the beginning. People need enough detail to make their decisions, while sensitive customer, employee, or financial data still requires appropriate controls. Broad access without context creates confusion; narrow access without a clear reason creates delay.
Set a Minimum Trust Checklist
Before an analysis reaches a decision meeting, ask a short set of questions:
Owner: Who can explain the metric and approve a definition change?
Source: Which systems and records feed the result?
Calculation: How is the metric computed, including exclusions and time windows?
Freshness: When did the data last update, and is that timing fit for the decision?
Access: Who can view the result and its underlying detail?
Lineage: Can you trace the value through its major processing steps?
Validation: Which checks confirm that the result is complete and consistent?
You do not need identical controls for every question. A directional campaign review and a regulatory filing carry different levels of risk. Match the rigor to the consequence, then document the choice.
Follow a Practical Implementation Path
A digital business analytics program can become too broad before anyone uses it. You may have a long list of data sources, tools, models, and stakeholders, yet no agreement on the first decision to improve.
Start smaller. Choose a recurring decision with a clear owner, a known cadence, and enough available data to test the approach. This creates a place to learn about definitions, access, usability, and adoption without redesigning the entire analytics estate.
The next-generation analytics approach discusses moving beyond reactive reporting toward questions and decision support in daily workflows. Use that shift as a design test: can a person move from a signal to a useful follow-up question while the decision is still active?
Start With One Decision and One Use Case
Write the decision in plain language. For example: “Each Monday, the revenue leadership team decides which pipeline risks need an owner before the weekly forecast.” That statement identifies the audience, cadence, object of the decision, and expected action.
Then define the questions that support it. The team may need to know what changed in pipeline coverage, which segments contributed, whether movement fits recent patterns, and which deals require review. Keep the first KPI set small enough that people can discuss definitions rather than scan a wall of numbers.
Name a business owner and a data owner. The business owner clarifies the decision and how the insight will be used, while the data owner documents sources, calculations, quality checks, and access. Shared ownership prevents the analysis from becoming either a technical artifact or an unsupported business wish list.
Choose an initial use case with a reasonable path to evidence. If the required identifiers do not connect or a core metric lacks an owner, address that gap before adding advanced models. A modest descriptive workflow with trusted definitions can support better decisions than a complex forecast built on disputed inputs.
Validate, Release, Learn, and Expand
Before release, test the result against known cases and source totals. Ask subject-matter experts to review definitions, segments, exclusions, and edge cases. If people cannot explain why a number changed, the workflow needs more context.
Release the first version to a limited audience that owns the decision. Then watch how they use it.
Do they return at the expected cadence? Which follow-up questions recur? Where do they leave the workflow to find missing context?
Feedback should improve both the analysis and the operating process. A confusing filter may need a clearer label, while a disputed metric may need a definition review. Sometimes the right fix is a data change; other times, it is a meeting change or a clearer decision rule.
Expand when the workflow supports a real decision consistently. You can add another segment, question, team, or data source, but each addition should have a purpose. Adoption grows when people see that the analysis helps them do work they already own.
Put Insights Into Everyday Decisions
An insight has limited value if it arrives after the decision, lacks context, or requires a specialist to answer every follow-up. Everyday use depends on shortening the path from signal to investigation without hiding how the answer was produced.
Interactive dashboards can provide a shared view while still supporting exploration. AI-assisted analysis can help summarize a change, suggest a follow-up, or make a complex question easier to express. Both work best when the underlying metrics, filters, and data relationships remain available for review.
The ThoughtSpot Analytics platform describes Liveboards as real-time interactive data views with drill paths that do not need to be predefined. The same page presents Spotter as an agentic AI analyst with a conversational interface, semantic models, and human feedback.
Move From a Summary to the Next Question
A dashboard should orient you, then help you investigate. If sales are below plan, the next question may concern region, product, seller, stage, or time. Fixed views can still be useful, but the workflow becomes more responsive when you can explore the dimension that fits the signal.
AI-assisted summaries can make that first scan faster to interpret. For example, a sales dashboard might summarize a revenue trend and prompt you to inspect the segments behind it. The visual below illustrates that concept; it does not prove financial results or product availability.
When you ask the follow-up, check the answer’s context. Review the filters, time range, metric definition, and underlying query details when available. A fluent response is easier to trust when you can see how it connects to governed data.
This pattern also helps data teams. Instead of preparing every possible drill path, they can focus on reliable models, clear definitions, and access controls. Business users gain room to ask the next question, while data leaders retain a reviewable foundation.
Focus Attention on Changes That Need Review
Your team does not need an alert for every movement. Exception-based reporting directs attention toward changes that cross a threshold, differ from an expected pattern, or affect a priority measure. The alert begins the investigation rather than settling it.
Suppose an automated insight flags an unexpected change in conversion, margin, or retention. You still need to check data freshness, seasonality, segment mix, operational events, and recent definition changes. An anomaly identifies where to look; it does not establish cause.
A panel that separates expected and unexpected metric changes can help people triage that review. The following figure illustrates how automated highlights might focus attention, with sample figures rather than verified business outcomes.
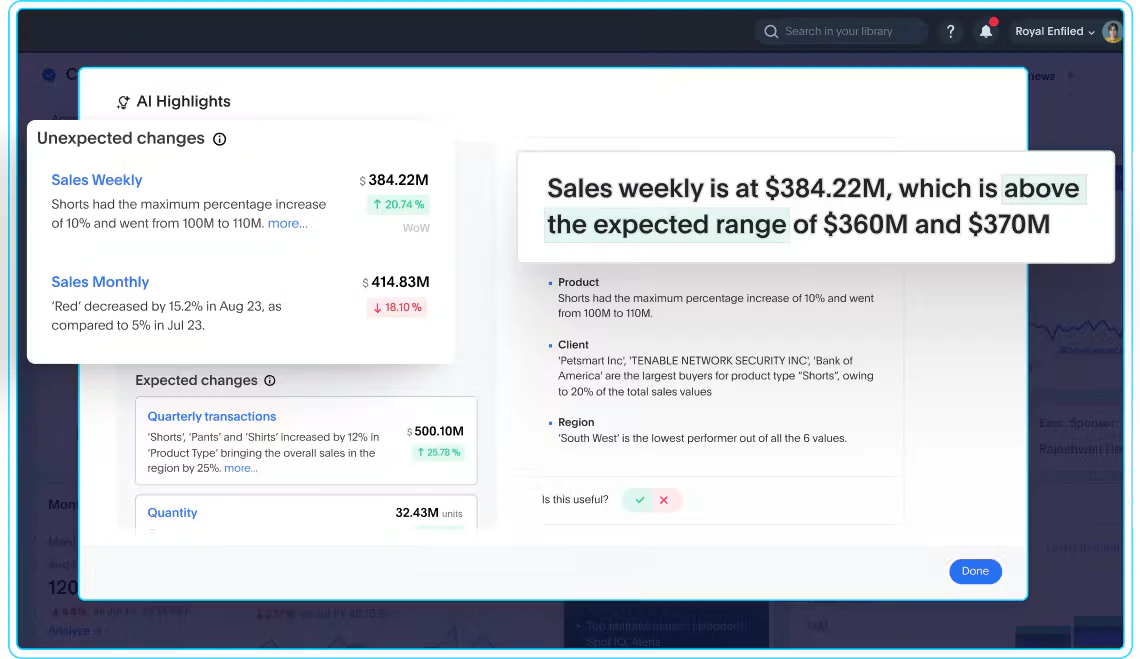
Make the review process explicit. Assign an owner, define when a flagged change needs escalation, and record the explanation when the team confirms one. That history can improve future thresholds and reduce repeated investigation.
The practical benefit comes from combining attention with context. A well-timed highlight, an interactive view, and a governed definition give you a stronger starting point for judgment. None removes the need to ask whether the signal matters for the decision at hand.
Make Trusted Questions Part of the Operating Rhythm
Digital business analytics works when questions, data, and decisions stay connected. Begin with one recurring choice, make the metric definitions visible, and let people move from a shared summary to the next useful question. As the practice grows, keep trust and usability in the same conversation.