

As the Senior Director for Marketing Ops at ThoughtSpot, I’m the owner of our full marketing and sales tech stack.
So, you know. No pressure.
I started out as a Marketing Analyst — certified Tableau superuser, the whole deal. And I’ve got to say what I can do now versus what I could do then is night and day. What used to take me hours in Tableau back in 2015 literally takes me minutes in ThoughtSpot.
There are really only two things that count in Marketing Ops: attribution and conversion rates. First, spot bottlenecks in the opportunity pipeline and figure out how to help move things along. Second, work out which channels are performing, bring that data to the team, and double down on what’s working.
Here’s how I use self-service analytics to keep on top of it all, and how you can too.
1. Use the “double donut” chart to quickly uncover insights
The double donut chart is one of my favorite visualizations in ThoughtSpot. It’s a great way to quickly see the discrepancies between two sets of data.
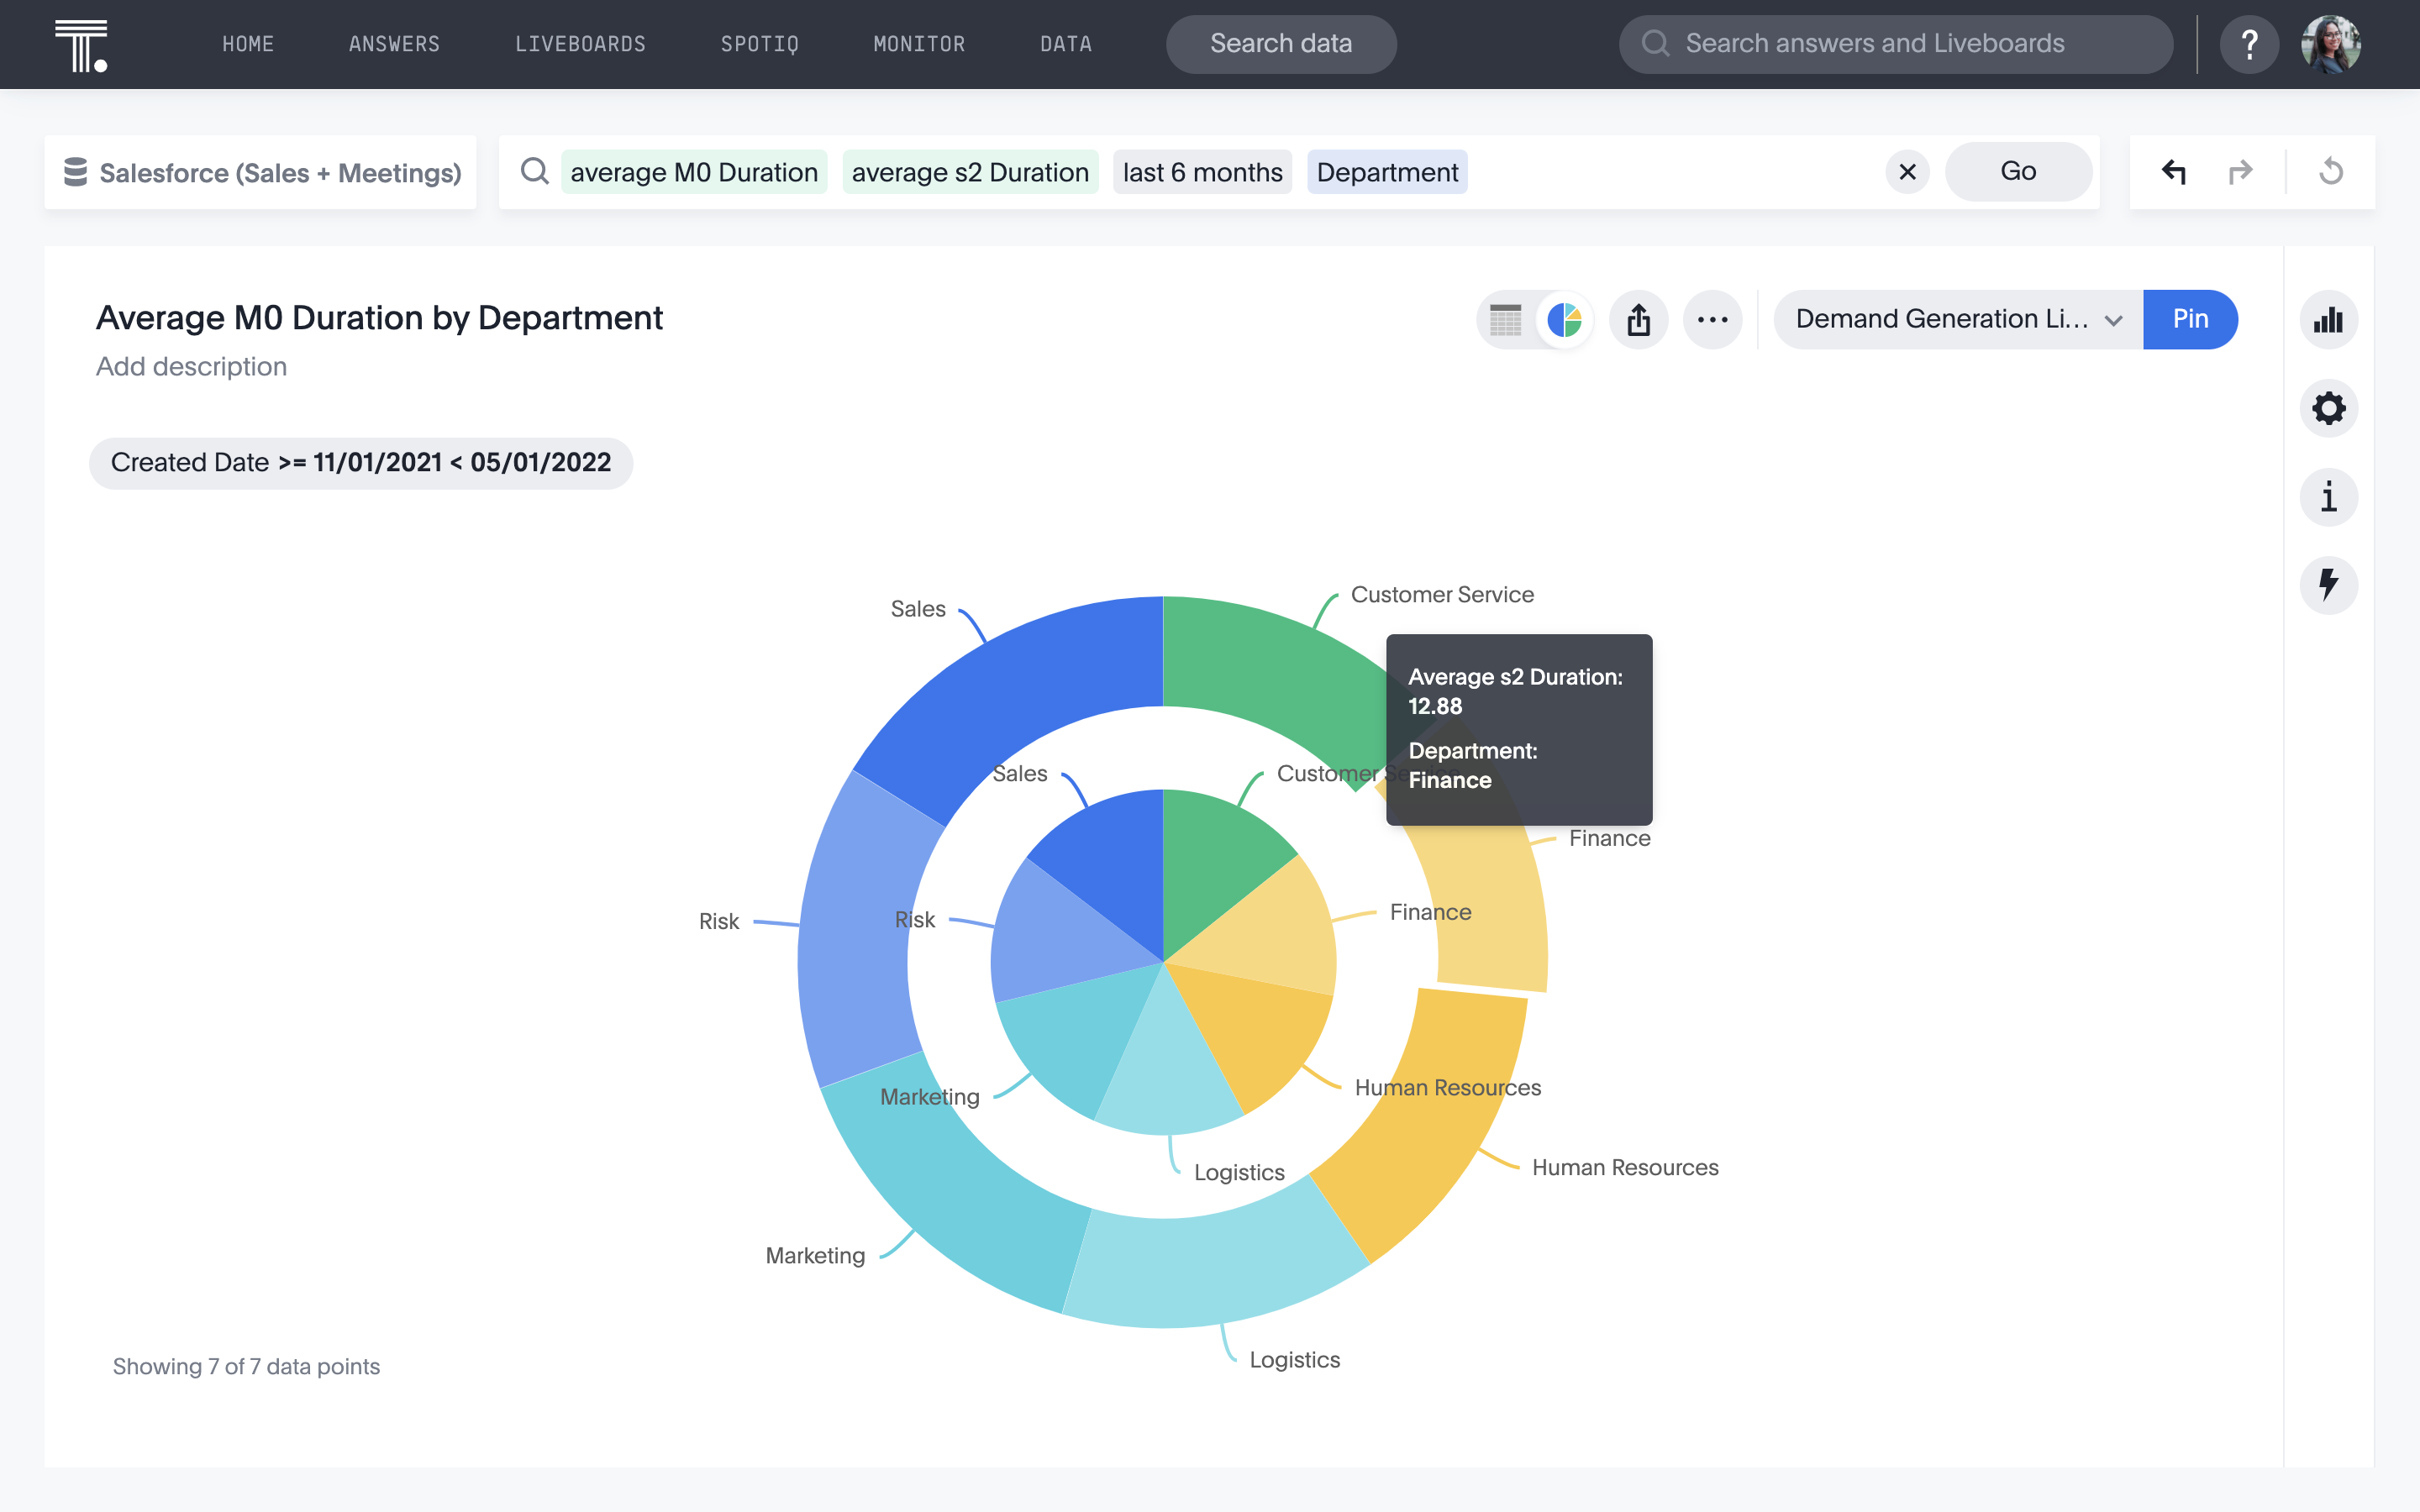
For example: you can see counts of opportunities in different stages together in one place. This visualization lets me immediately spot if there’s an issue.
Say, for instance, that I notice that the SDR sourced conversion rate from initial meeting to stage 2 is low. That information on its own isn’t very helpful. If I go to the SDR leader and tell her that we’re losing the majority of SDR sourced leads, she’s just going to ask me why. It’s far more helpful if I drill down to the actual cause of the issue and identify actionable insights.
Let’s say that when we drill down, I see that the leads were non-responsive after the first call, or weren’t ready to buy. Then, I’ll know that the issue is a question of meeting quality, and I can make suggestions for how we can tighten up our discovery process before we take the time to set up a meeting. On the flip side, I can also drill down into the meetings that did convert, to find out exactly what that SDR did differently.
We all know it’s never a good idea to bring any sales leader a problem. But if you go to them after you’ve done a bit more digging, you’re not just pointing out an issue—you’re giving them a data-informed solution. At ThoughtSpot, our Sales and Marketing alignment is great, and I think a lot of that comes down to the fact that we’re all looking at the same data.
2. Go deep with conversion rates
In Marketing Ops, we’re not usually working towards quarterly goals - we’re trying to make improvements wherever we can, and our priorities can shift on a daily basis.
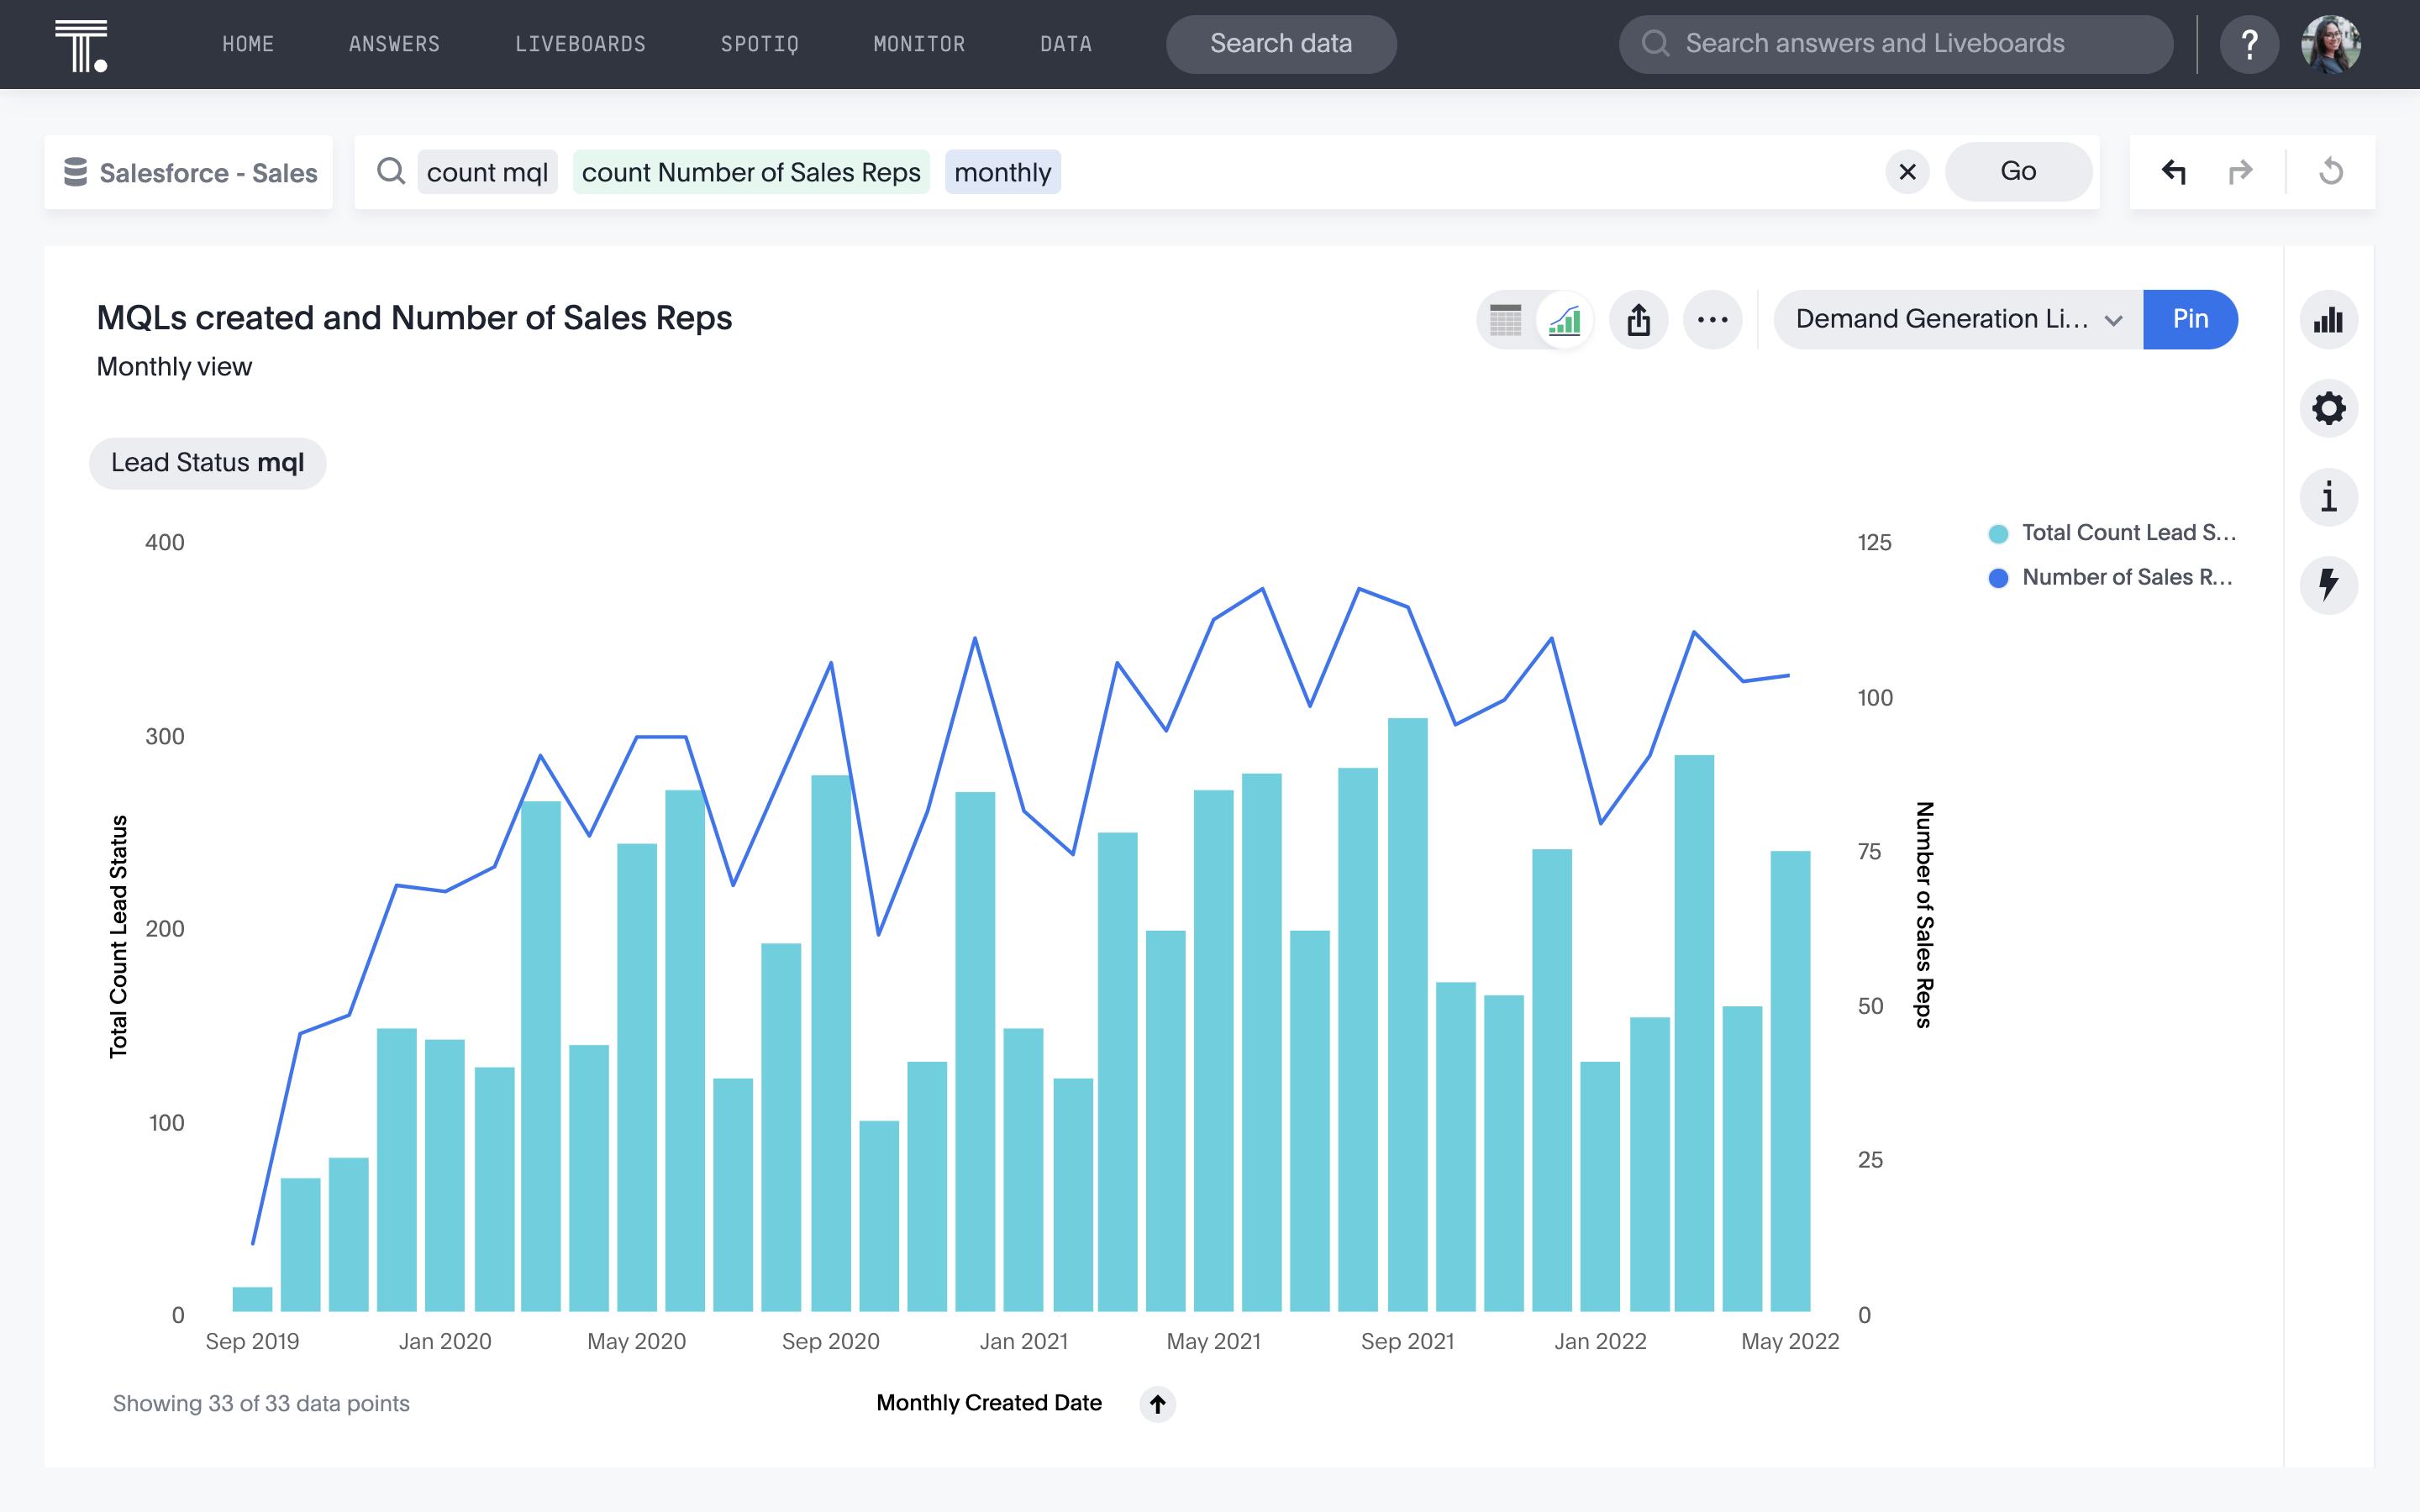
However, conversion rates are always a huge focus for our team. Having data at my fingertips means I can dig deeper before I share it out. Before I share the data with other teams, I’ll try to answer any questions they might have beforehand. For instance, I’ll pull out:
Attribution: where did those MQLs come from?
Persona: who were we talking to?
Again, I’ll use the insights I gather from drilling into our conversion rates to drive immediate action. For instance, I might go to our Sales team and say, “We’ve got a problem with conversion—here’s how we could fix it.” Or I could go to our Marketing team and say, “We spent too much on this campaign for the conversions we saw. How about we double down on targeting this higher-converting persona instead?”
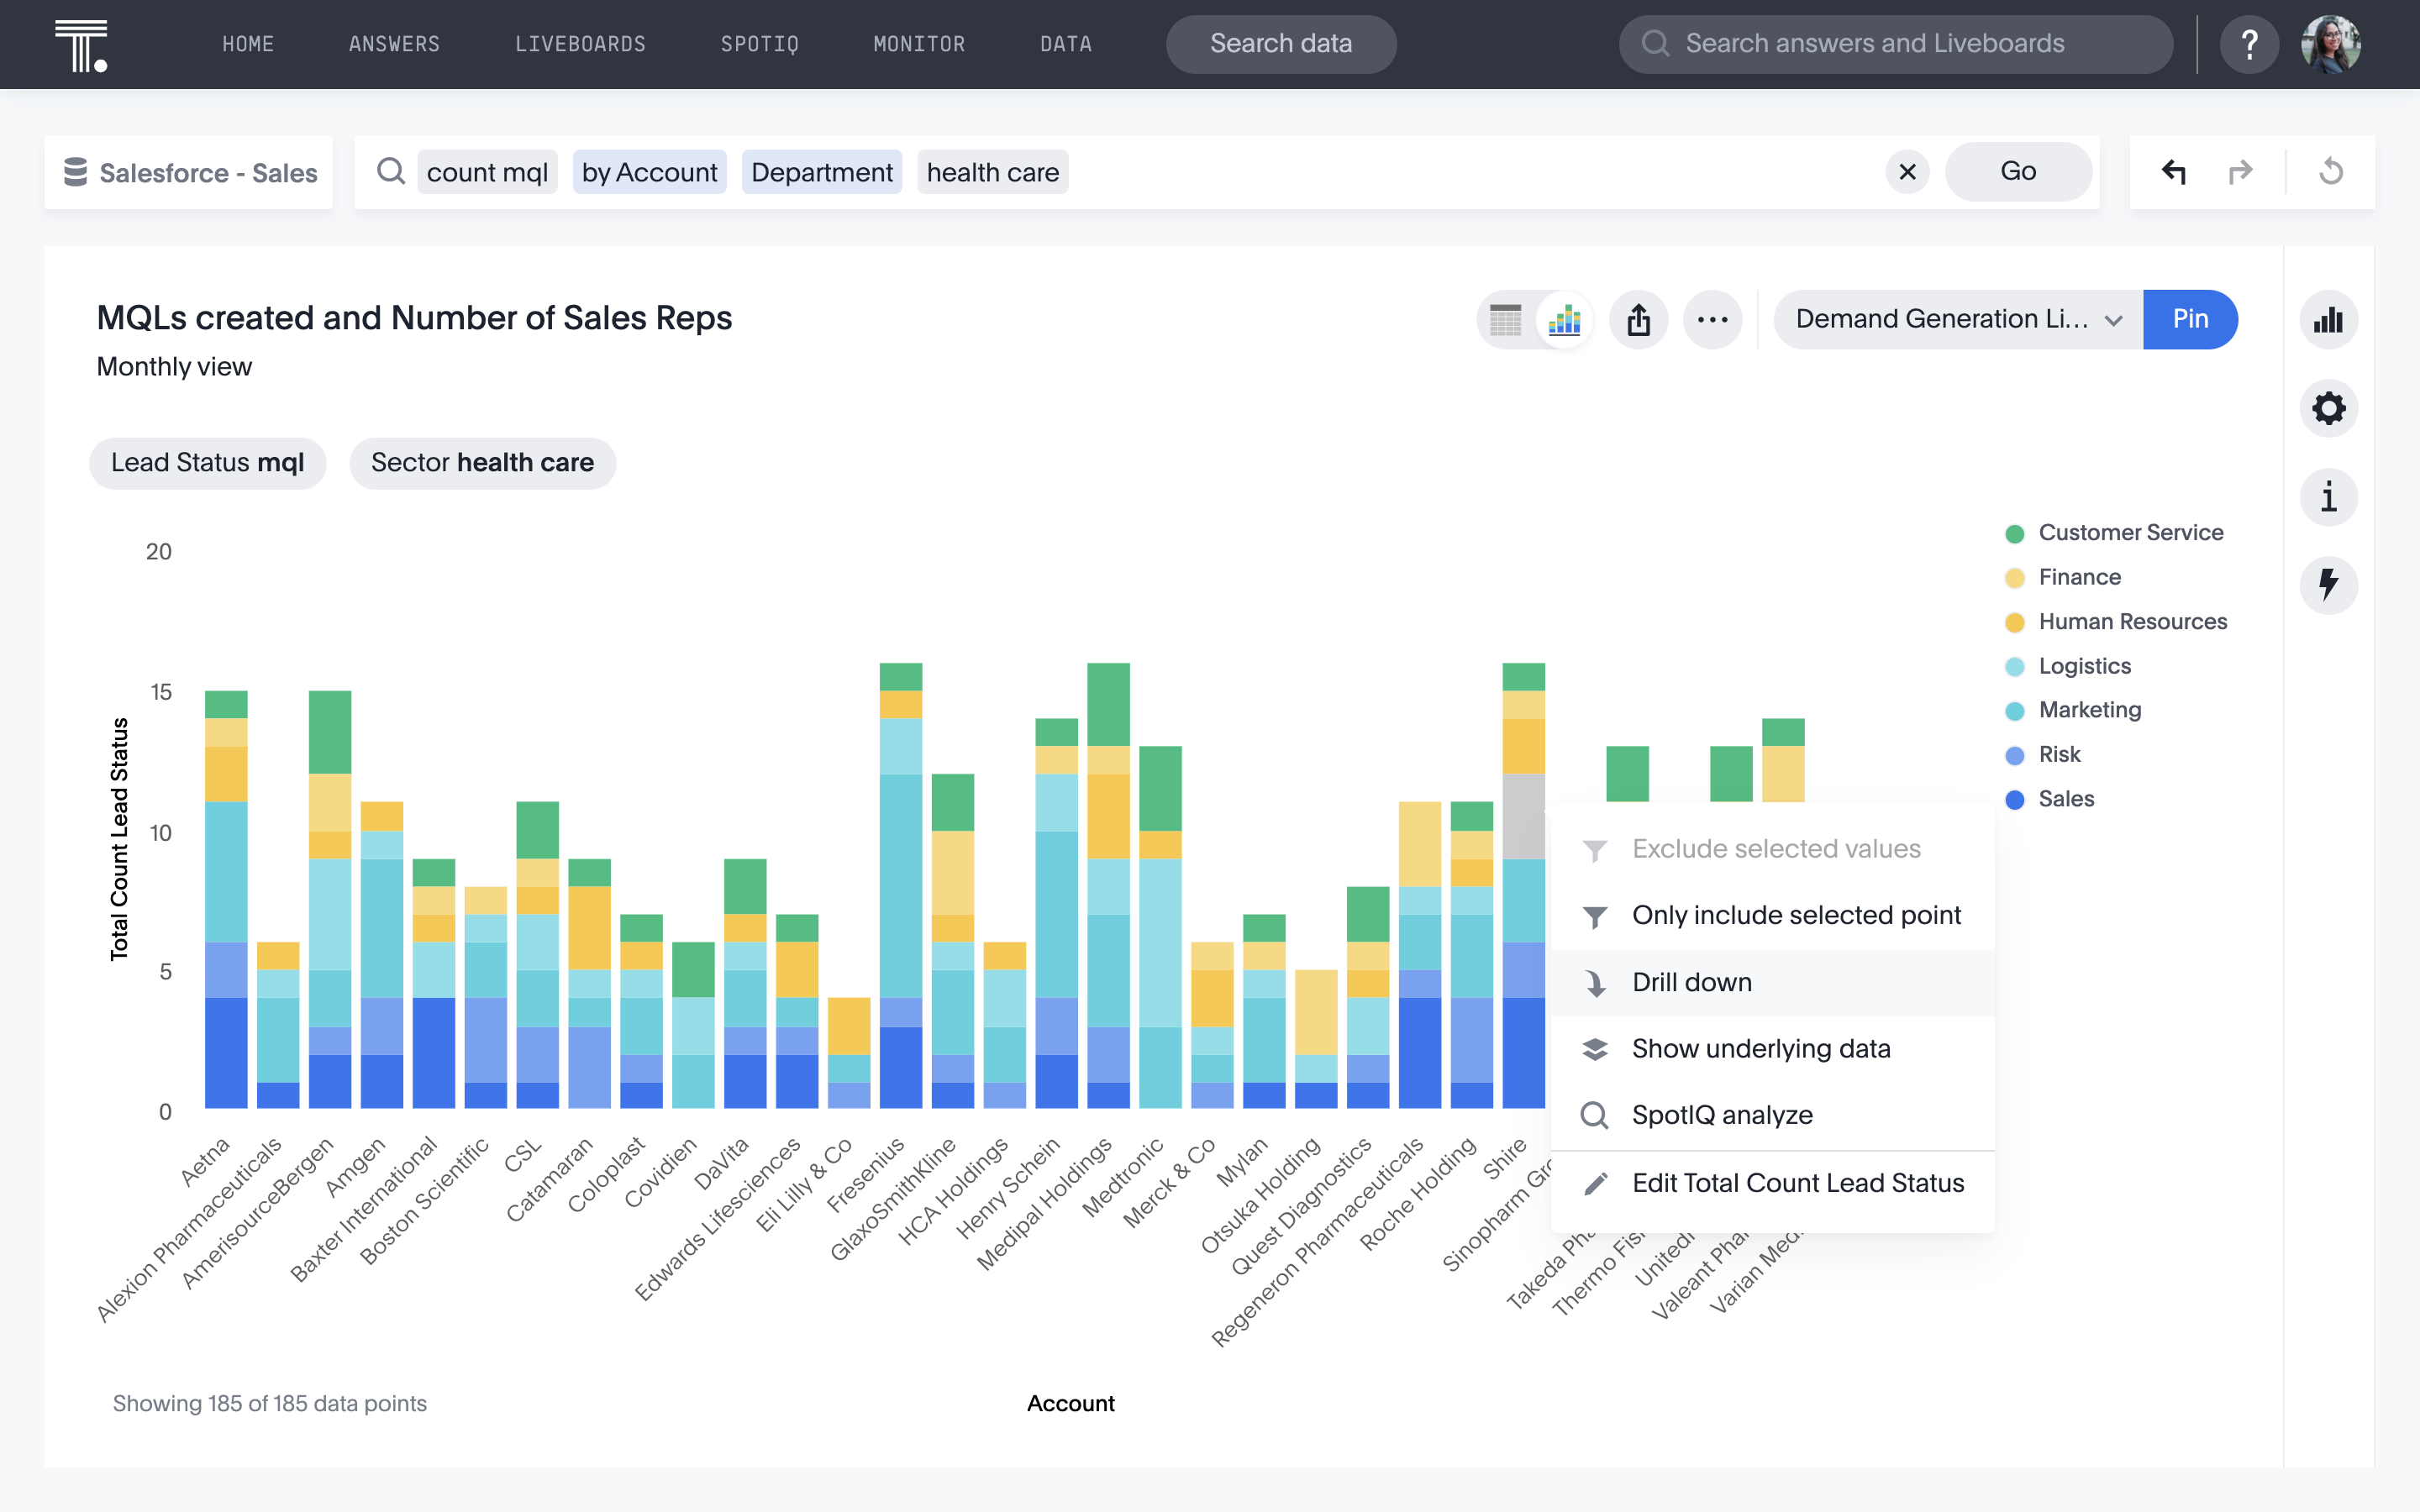
3. Prioritize accounts with detailed breakdowns
One of my favorite ways to use our drill-down function is to hand our AEs a list of accounts that are highly likely to close with a little extra attention. It’s satisfying to use the data to spot opportunities for sales that we would otherwise have missed.
I regularly pull up accounts that are showing intent of an imminent evaluation, but that our AEs are not currently focusing on. These might be great opportunities for a win that are getting overlooked.
Here’s what it can look like in practice: you can take a look at the accounts being handled by a single rep. Through drilling and altering your search, you can rule out accounts that aren’t a focus for different reasons, such as:
Do we have over [X] leads/contacts within the account?
Are the contacts from relevant departments (product, engineering, business intelligence)?
Does this prospect have sufficient revenue to be a good fit for our product?
Once I’ve done that, I have a list of accounts that have a high conversion potential, but that we haven’t been targeting so far.
With that level of granular insight, I can go to our AE with a list of accounts that they could potentially close in short order.
Doing this in Tableau back in 2016 would have taken me hours. With self-service analytics from ThoughtSpot, it literally takes me minutes because we’re live querying in Snowflake.
In Marketing Ops, data isn’t enough
You need to be able to pull together the right insights to help the Sales and Marketing teams take action. You need data, yes, but you also need to be able to use that data to tell a story. And you need to be able to get the information together quickly, so you can make insight-driven decisions about what to do next.
Basically, you can use a self-service analytics platform like ThoughtSpot—or you can use another BI tool, and sit watching the spinning wheel of death. For hours.
Curious? You can find out how marketing professionals are using ThoughSpot to optimize conversion rates here or start a free trial and see for yourself.


