

In 1895, a German physicist was trying to determine if he could observe cathode rays escaping from a glass tube and noticed an unexpected glow on a fluorescent screen several feet away. On further examination, it turned out to be a different kind of radiation that we now know as X-ray. Fast forward to today and you can’t even imagine diagnosing many medical problems without the X-ray.
There are many instances where someone was looking to study one thing and accidentally discovered something completely different and revolutionary — like the microwave oven or penicillin.
A similarly accidental discovery is shaking up the modern data stack. I’m talking about a language for modifying data queries. While it doesn’t quite belong in the same class of revolutions as the above list, it is one of the most powerful enablers of self-service analytics.
What is query modification?
Before we get into what a query modification language is, let’s level set on what query modification is and why it matters. New data often leads to new questions. For example, if you look at weekly revenue and you see a trend that you did not expect, you may want to dive deeper into an anomalous point. Often the query to dig deeper is a derivative of the old query that was used to get the first piece of data. For example, in the case above all the metrics and filters remain the same, you just add one more filter and change the group-by clause to how you want to drill. Query modification is the act of modifying the original query to a new query to answer the next exploratory question.
What is a query modification language?
Imagine you or your visualization tool has written a SQL query to compute total revenue. This may look like this:
select SUM(Revenue) from fact_tableNow suppose you want to break this number down by product category. The new SQL you need is going to look like this:
SELECT dimension.product_category, Sum(Revenue)
from fact_table
JOIN dimension
ON fact_table.product_id = dimension.product_id
Group by dimension.product_category
We typically rewrite SQL queries to match our intent.
But imagine a system that could simply take the command “Drill down by product_category” and modify the first query into the second. You can probably think of 10 or so common ways of modifying a typical query. What if there was a language that allowed you to express all of them? Or even better, you were allowed to compose these commands arbitrarily to keep modifying the query? That is the idea of a query modification language.
A query modification language, or QML, provides a set of instructions that can modify a data query in specific ways.
In the rest of this blog, I won’t talk in terms of a QML for SQL, but a QML for ThoughtSpot’s search language but the same ideas can apply to any data query language.
For example, suppose you have a query that gives you “top 10 products that produced the most revenue in last year”. Now suppose you want to change the query to consider only the products sold in the USA. A QML will have a phrase like “Add Filter Country = USA”. This of course is one of the simplest examples. But once you consider all the different ways in which a user may often want to change a query, it becomes a fairly rich set of operations. A common set of operations we see users doing are drilling down into a number, showing specific rows that make up a specific aggregate number on a data visualization, excluding specific values (for example null), and changing the sorting order of a query or sorting direction
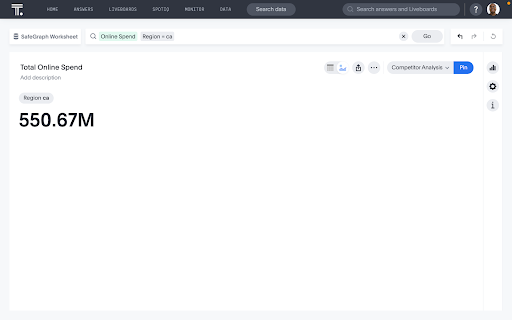
In the search above, we have filtered our simple online spend search results for region equals California.
What are the advantages of a query modification language?
The advantage of having a query language coupled with a query modification language is that it becomes a way to do unconstrained exploration. From any question, you can ask a related or follow-up question. And when that inevitably sparks another question, you can keep exploring until you actually get to the insights you are looking for. This entire cycle happens nearly instantaneously, with only seconds between successive queries.
This is the fundamental reason why we say Dashboards are Dead, and modern businesses run on Liveboards. Dashboards serve you answers to questions that were premeditated months ago. There’s little freedom to ask the next question. Liveboards, on the other hand, get you started in the right place but don’t box you in. The entire neighborhood, including any and all exploratory paths, are accessible to the end-user.
We have seen the majority of data organizations are stuck in a paradigm where every time new requirements show up, the data teams get busy building new data pipelines and new dashboards - after the user has submitted a JIRA ticket. Too often, the requirements have already become dated before these dashboards are ever delivered. For a Fortune 500 company, it is not unusual to be maintaining tens of thousands of dashboards without even knowing which small fraction actually delivers value. As some data leaders have correctly identified, dashboard producers care more about the dashboards themselves than the people who consume them.
Liveboards introduce a new paradigm for building analytics that drastically cuts down on the busy work for data teams while giving business people what they need from their data.
Discovery of QML
Our initial vision for ThoughtSpot was to build a product that empowered anyone, regardless of their technical skills, to ask data questions in the vocabulary they understood and get the correct answer. We originally did not think about users modifying and refining their queries, other than just editing their queries in a manner that someone would edit their Google search. We were very focused on creating an experience that looked and felt like searching on Google, yet behind the scenes, was generating SQL queries and visualizing data.
However, we very quickly realized that in real life, data questions are fairly complex and hard to express precisely in natural language. There are typically too many ambiguities that can become tedious for someone asking the questions (although it does make a compelling demo!) When you are building an application that will be used to inform business-critical decisions, it’s critical to limit any potential misinterpretation of the user’s intent.
Armed with these insights, we changed our goal to design an interface that is as easy as using Google and does not require any training, yet works in a very deterministic way without making any probabilistic assumptions. This led to an approach where we built a platform that in effect is a factory for generating Domain-specific languages (DSL) based on your business language and entities relevant to your business (product names, customers, categories, etc.).
Looking back almost 10 years now, this turned out to be one of the most important and fundamental choices behind ThoughtSpot’s wide adoption.
Building in interactions
Two of the most fundamental interactions for a BI tool are filtering and drill-down. Filtering is seeing the same data visualization but restricting input records to an area of focus, such as a specific time period or specific region.
The search above applies filters for both time (last 24 months) and place (North America, APAC).
Drill-down is expanding on a specific statistic. For example, if you are seeing “top 10 products by revenue” you may choose to drill down into the revenue coming from the top product by asking how revenue from the top product breaks down by region. Most BI products require the dashboard author to pre-program the columns on which a consumer of the dashboard is allowed to filter or the paths along which they are allowed to drill down.
In the interaction above, we drill down on our top selling product type this year to uncover how sales for that product type break down by region.
Of course, designing a tool for business users, we did not want to constrain the consumer of a dashboard to be limited to the filters and drill paths configured by the author of the dashboard. We also did not want any additional effort in enabling any new interactions.
Keeping search and answer in sync
One of the product design points we debated heavily was when someone types a query, and then they modify the query through a UI interaction, what happens to the search query?
There are three options:
The user goes into a new experience where the model of interaction is no longer search
The query text remains the same (perhaps greyed out to indicate that it does not match the answer)
Query changes to match the new answer
The first option would have been the easiest answer, but it would reduce the experience down to any other traditional BI product after the first UI interaction, so we never really considered it.
The advantage of #2 was that it is a much simpler system to build and for an end user they are always looking at a query they typed as opposed to something system generated that now they have to try and understand.
The advantage of #3 was twofold. First, the user can seamlessly go from modifying the query through UI interaction and then modifying the query in the search bar, and back. All the interactions would make sense. With approach #2, there is a danger that you may ask for “Revenue by state”, then drill down into California by category, and then add the filter “last year” and expect the result to be “revenue for California in the last one year by category” But actually it will be “Revenue by state for last one year”. This is avoided by #3.
The second advantage of this approach is that as the query changes through UI interaction, it’s a way for end users to discover different ways of asking the question in the search bar.
Between #2 and #3, there was a strong debate. Initially, we did not know how to modify the query in every context in a way that didn’t create too much cognitive overhead for the user (reduce the edit distance between old and new query as much as possible while getting to the semantics of the new query). Prototyping and building approach #3 took two years of iteration and refinement to create something that was consistent, usable, and always correct.
When a user did a drill down or changed the filter in the UI, we wanted to keep their search query in sync with the answer so they could subsequently continue modifying the search query.
After the search above, we drill down twice. Each time, the search bar updates to represent the search behind the data we are visualizing.
Enriching interactions
What started out as enabling three interactions eventually expanded to a substantial list of query modifications.
Below is the subset of the most important interactions we added to our interaction model:
Adding a filtering widget and modifying filter values
Drilldown in any direction
Exclude/include a certain data point from the data
Comparing metrics period over period
Comparing different cohorts
Show the most granular data that makes up a specific number on the visualization
Add/remove/edit sorting columns and sort direction (ascending vs descending)
Adding/removing a having filter (post-aggregation filter)
Change time bucket granularity (monthly -> daily) for date-time columns
In building these interactions, it became clear a lot of the query change intent could be described as a combination of more primitive operations.
For example, drill-down means you drop all the other measures in the query other than the measure of interest
Add filters that represent the specific data point you want to drill down on
Remove all existing grouping in the query
Add grouping for the column on which you want to drill down
This led to a mechanism of combining a sequence of primitive operations into a macro query modification operation. This allows for much more complex operations, such as comparing two data points on a visualization to see which segments changed the most contributing to the overall change.
Birth of a query modification language
Once we had built a large subset of the above interactions, we realized that what we were building was a true companion language to our query language, which can be called a query modification language, the first of its kind. This language became the foundation of many powerful capabilities.
Note that the QML described here complements our own ThoughtSpot Modeling Language (TML) but is a very different kind of language in the sense that users are never exposed to a programming language (other than when they invoke APIs) and it is exposed purely as a visual interaction language.
Putting it all together in Liveboards
The query modification language is the foundation of many of the powerful capabilities that make Liveboards so different from dashboards. The QML sits outside of the search bar and gives users two ways of interacting with the query. Many times QML can be a way that someone can get to a complex query by breaking the steps into fairly simple modifications.
Most dashboards are designed based on requirements given by business users and are mostly static in their functionality based on the requirements known at the time of authoring. In contrast, Liveboards use the visualizations only as a starting point for data exploration. When a business user looks at the metrics and KPIs on a Liveboard, they invariably generate new questions. The answer to those questions generates new questions.
Having a system based on this QML means that the business user can get to all those questions within minutes instead of waiting on the data team for every new question.
While dashboards typically provide users a static of their data, Liveboards are simply a starting point. In the interaction above, we dive into Explore mode, select a filter recommended by ThoughtSpot’s AI, and then drill down one more level to get to an entirely new answer.
As a business user with all the context in your brain, you can get to the right question to ask your data to truly find insights and add value. Many times you arrive, at this question by asking a lot of questions.
With QML as the foundation layer, Liveboards are the perfect tool to answer any data question.


