


Interactive analytics has a simple promise: answers should show up when people need them, not after the moment has passed. But when usage spikes, many teams end up paying twice: once in latency and again in compute.
We recently published a blog introducing Snowflake Interactive Analytics and what it means for ThoughtSpot customers. This follow-up goes deeper on:
1. What “native integration” looks like in practice for ThoughtSpot on Snowflake Interactive Analytics.
2. What we saw in early testing, including performance and cost signals.
If you want the walkthrough and demo, you can watch the webinar replay here.
Snowflake Interactive Analytics: The Primitives
To understand why this integration is performant, we have to look at the two new Snowflake objects driving it.
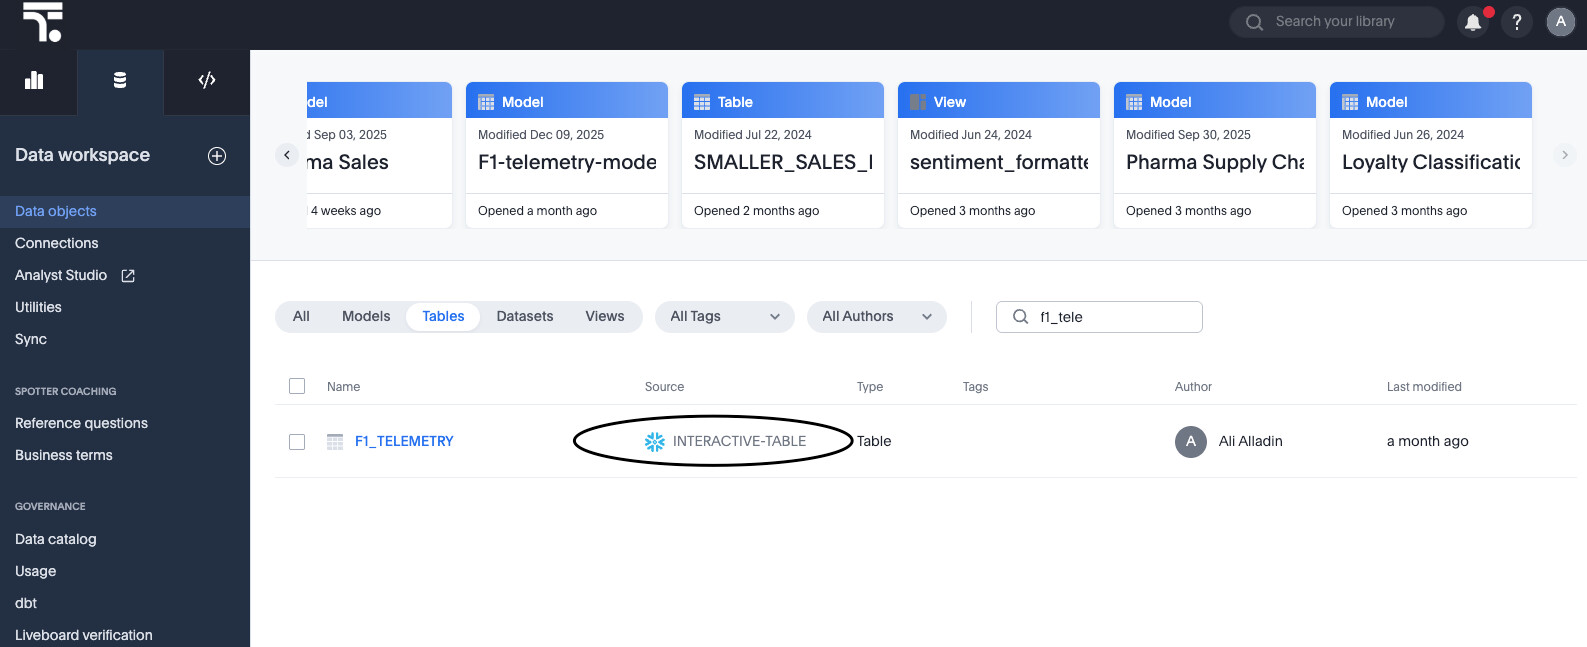
1. Interactive Tables
These are a new table type optimized for rapid data access. Unlike standard tables, Interactive Tables are designed for simple queries and high-concurrency ingestion.
The Key Difference: They require a defined schema and are highly optimized when you utilize Clustering Keys. Clustering is more aggressive for Interactive Tables and offered at no cost.
Best Fit: They excel at serving data for dashboards, embedded apps, and APIs where query patterns are relatively predictable.
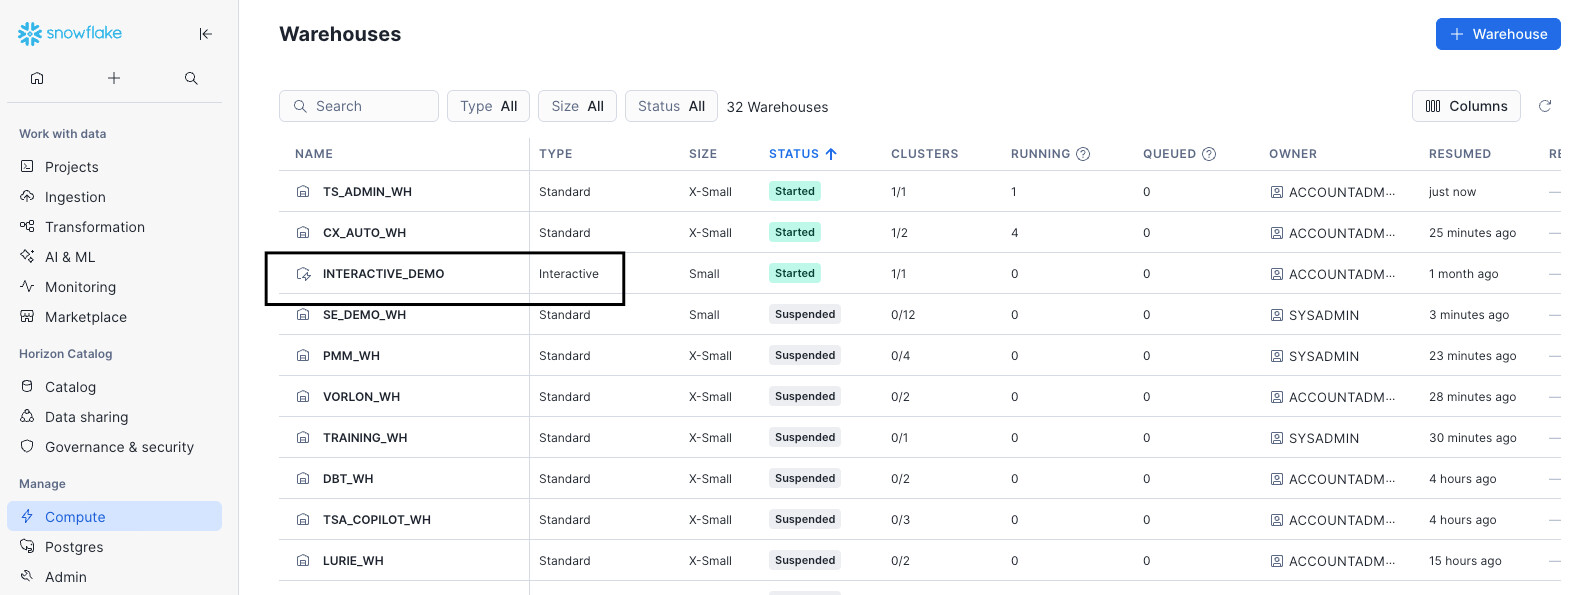
2. Interactive Warehouses
This is the compute engine tuned specifically for these tables.
Warm & Optimized Caching: Designed to stay on and warm, Interactive Warehouses use a sophisticated local SSD-based caching mechanism to keep frequently accessed (“hot”) data readily available.
Concurrency: They are built to handle a high volume of simultaneous queries without the queuing often seen in standard warehouses during peak times.
For more details, check out the “Getting Started with Snowflake Interactive Tables” guide.
Native Integration: What Changes (And What Doesn’t)
The most critical aspect of this integration for ThoughtSpot customers is that it is native and transparent.
There is no "connector" to install and no data movement required. From the ThoughtSpot perspective, an Interactive Warehouse looks exactly like a standard Snowflake warehouse.
Seamless Setup: You connect ThoughtSpot to the Interactive Warehouse using the same connection flow you use today.
Full Feature Support: ThoughtSpot’s Liveboards, Semantic Layer, and embedded analytics work out of the box.
Governance: Your existing Row Level Security (RLS) and governance rules defined in Snowflake or ThoughtSpot continue to function without modification.
The Constraint to Know:
Interactive Warehouses are optimized for speed, not long-running complexity. Snowflake enforces a default timeout (typically 5 seconds) on queries to ensure throughput. This means this architecture is not for heavy ETL or massive cross-database joins; it is for serving answers to users now.
Where This Fits Best
Snowflake Interactive Analytics is a strong fit when you can keep query patterns predictable and the experience needs to stay responsive, even as usage grows. For example:
Well-designed dashboards, such as real-time inventory status and performance monitoring dashboards that get hit hardest during peak moments.
Embedded analytics, where concurrency spikes are common and latency shows up as product friction.
Implementation Walkthrough
Implementation requires a few specific steps on the Snowflake side, followed by a standard connection on the ThoughtSpot side.
1. Choose the Right Workloads
Success begins with selection. Target workloads that require low latency and have high user concurrency.
Good Fit: Customer-facing embedded analytics, executive Liveboards, and operational dashboards.
Avoid: Heavy ETL transformation jobs or ad-hoc exploration that involves massive, complex joins across unclustered columns.
2. Create Interactive Tables
When creating your Interactive Tables in Snowflake, pay close attention to the CLUSTER BY clause. Because Interactive Tables are optimized for retrieval, you must cluster the table by the columns your users filter on most frequently (e.g., Region, Date, or Category). This allows the engine to perform "partition pruning" effectively, reading only the necessary data. Read more on key strategies for selecting a clustering key.
3. Create the Interactive Warehouse
Provision and resume the Interactive Warehouse. A critical operational detail here is cache warming. Because performance relies on data being in the local SSD cache, performance improves as queries run and the cache populates. When benchmarking, ensure you allow a "warm-up" period after resuming a warehouse to see true performance numbers.
4. Connect ThoughtSpot
In ThoughtSpot, create a new connection or edit an existing one to point to your new Interactive Warehouse. Validate the setup by loading a Liveboard. You should see immediate responsiveness, particularly on filtered queries that hit your clustering keys.
A Note on Workload Fit
This capability is designed for fast, straightforward analytical queries. As with any performance-focused architecture, you’ll get the best results when the workload matches the design. We’ll share a quick best practices checklist later in the post.
Performance Testing: The Proof
We didn't just build the integration; we tested it against realistic scenarios to quantify the value.
The Test Setup:
Data: TPC-H dataset at Scale Factor 100 (SF100).
Volume: 8 tables, approx. 25 GB of data.
Comparison: We ran identical workloads on a Small Standard Warehouse (Standard Tables) vs. a Small Interactive Warehouse (Interactive Tables).
Scenario: We simulated realistic Liveboard usage, focusing on summarizing metrics and filtering—the bread and butter of business analytics.
The Results:<br>The Interactive Analytics architecture performed measurably better in both speed and cost efficiency.
Faster Execution and Lower Credit Consumption
In our test, Snowflake Interactive Analytics performed measurably better for the Liveboards we built and the usage patterns we ran.
Here’s a summary of results from our comparative ThoughtSpot Liveboard test:
| Metric | Interactive | Standard | Improvement |
|---|---|---|---|
| Average execution time (ms) | 760.3 | 2152.8 | 65% |
| Credits used | 0.0028 | 0.0083 | 67% |
Interpreting the Data:
The 65% improvement in speed means dashboards load in sub-second timeframes, keeping users in the "flow" of analysis.
However, the 67% reduction in credits is equally significant. Because the queries finish faster and leverage caching, the compute resources are freed up almost immediately, allowing you to serve more concurrent users with the same warehouse size.
By moving high-concurrency, low-latency workloads to this architecture, you stop paying for "waiting" and start paying only for "answering."
What This Means for ThoughtSpot Customers
Modern analytics workloads often create a big trade-off: you either keep things fast and pay for it, or you manage cost and accept lag.
The promise of Snowflake Interactive Analytics, paired with ThoughtSpot’s intuitive analytics front end, is that you can narrow that trade-off for the workloads it’s designed for. You keep the same ThoughtSpot experiences, but with a serving layer built for interactive demand.
And if you’re the person who gets paged when dashboards crawl, you already know this is not a theoretical problem. It’s a Tuesday.
Next Steps
The best way to evaluate Snowflake Interactive Analytics is to run it against the dashboards and embedded use cases your teams rely on most.
If you want to see how ThoughtSpot on Snowflake Interactive Analytics performs in practice, request a demo here.
Resources
FAQ and Best Practices
1. What are good use cases for ThoughtSpot on Snowflake Interactive Analytics?
Dashboards with intentional design and well-understood query patterns
Embedded analytics experiences where concurrency spikes are expected
Use cases where “fast” is the difference between adoption and abandonment
2. What should I look out for when using Snowflake Interactive Analytics?
Queries that get overly complex (many grouping or filtering fields, heavy expressions)
Scenarios where query shapes are unpredictable and hard to constrain
3. How to ensure successful implementations?
Cluster Aggressively: Your Interactive Table performance lives and dies by the CLUSTER BY clause. Match it to your users' common filters (Time, ID, Region).
Watch the Clock: Interactive Warehouses have a default 5-second timeout. This is not for complex ETL; it is for rapid-fire analytics.
Warm the Cache: When benchmarking, run your queries a few times. The first run pulls from remote storage; subsequent runs hit the local SSD cache for maximum speed.
Results disclaimer: This testing was conducted by ThoughtSpot in November and December 2025 and these results reflect a specific dataset, two Liveboards, and a defined set of usage patterns in our environment. Your results may vary based on data shape, dashboard design, and query complexity. We recommend testing your own highest-value interactive workloads to validate performance and cost outcomes for your use case. Results are for informational purposes only, not performance guarantees. ThoughtSpot disclaims all warranties and liability related to these results. ThoughtSpot and Snowflake are commercial partners.


