

Ask any analyst how they spend the majority of their work day and they’ll tell you: Performing remedial tasks that provide no analytics value. 92% of data workers report that their time is being siphoned away performing operational tasks outside of their roles. Data teams waste an inordinate amount of time maintaining the delicate data-to-dashboards pipelines they’ve created, leaving only 50% of their time to actually analyze data. If we look at it another way, 50% of your data team’s headcount budget is being wasted on remedial tasks versus analysis. Let that sink in. If talent is every organization's biggest expense and investment, dashboards are squandering half of it.
With so much operational overhead, data teams have little time or energy left over for true innovation. Indeed, a whopping 68% of data teams say they lack adequate time to implement profit-driving ideas. The culprit? Time wasted performing operational tasks outside of their primary role.
1. Fragmented tools beget fragmented insights
Consider for a moment the last dashboard your team created or that you yourself personally came across. Was it a clean, lean, optimized insights machine? Or was it made up of a patchwork of disconnected, inconsistent technologies, with each downstream point dependent on the viability of the next? For the last 20 years of BI, it's been the latter. Dashboards have institutionalized data teams into thinking this is an acceptable data-to-insights supply chain. Instead, they have failed to make any meaningful impact on your company’s bottom line and turned expensive data teams into systems management and operations specialists. If that sounds broken and inefficient, it’s because it is. Yet many data teams are still trapped in this flow.
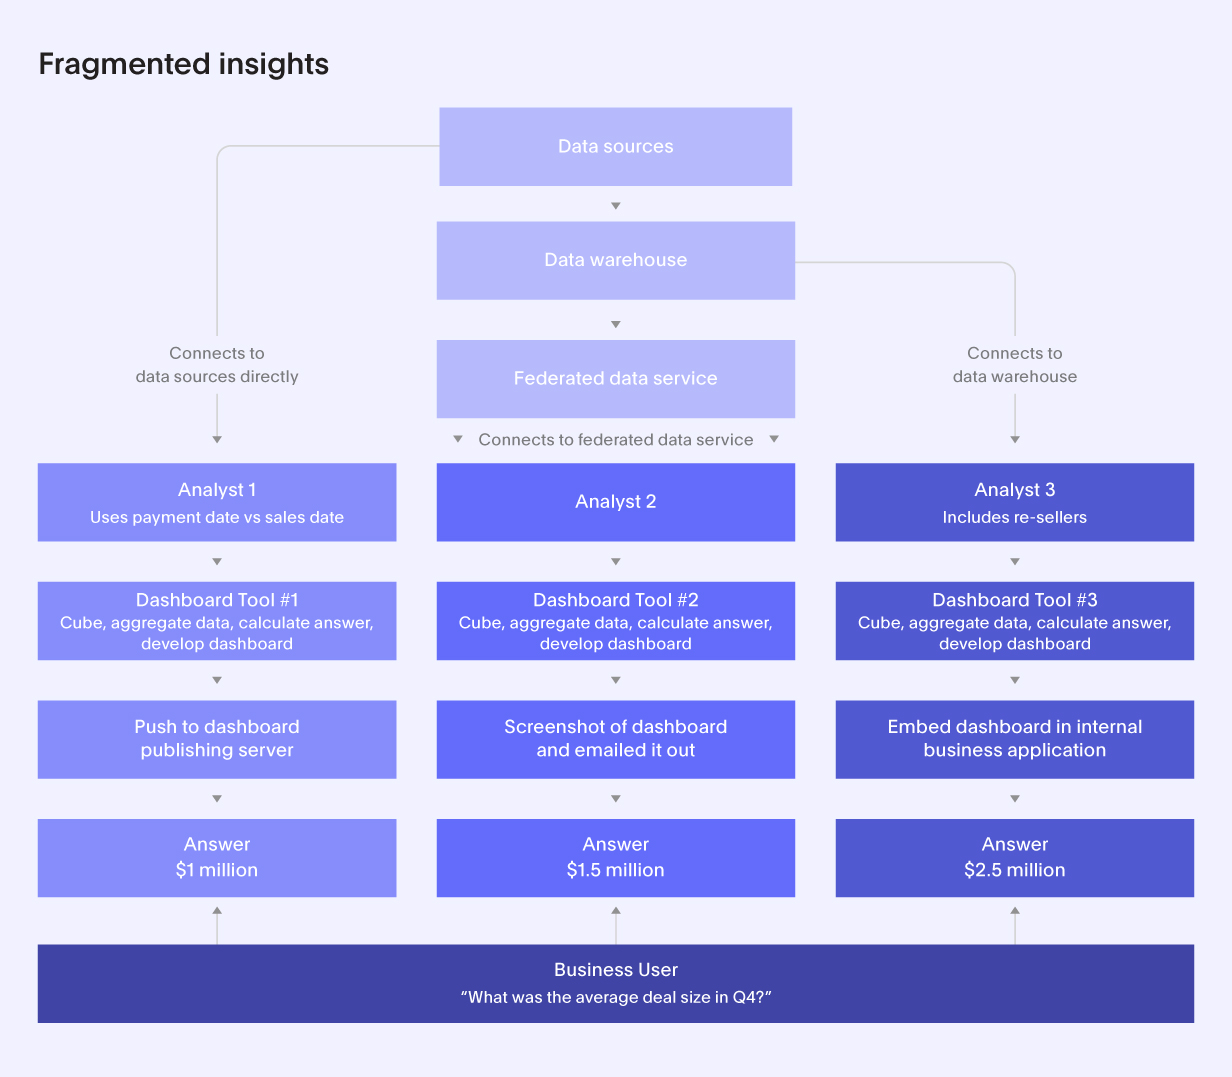
This is just one example of the operational costs associated with maintaining a single dashboard tool for a single department. As soon as you try to roll this out to a new department, you have to spin up a whole new set of publishing pipelines, meaning more servers and more data remodeling outside of your cloud data warehouse. What’s more, most organizations have at least three competing dashboarding tools based on an individual data worker’s preference. These tools add bloat to an already bloated data infrastructure, create inconsistent answers, compound security and data governance headaches, and require business users to leapfrog from tool to tool in order to self-serve insights.
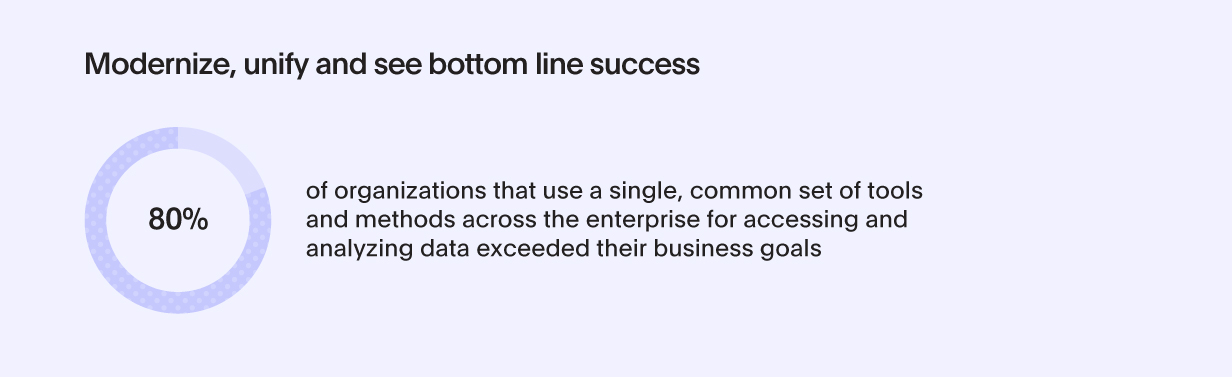
This fragmented approach to insights tools and data directly correlates with diminished business success. Data and analytics has been touted as the key to giving organizations a competitive advantage, but fragmented insights for business users achieve just the opposite. Nothing illustrates this more clearly than the fact that 80% of organizations who standardize on a single, common set of tools and methods for delivering insights to business users report exceeding business goals.
2. The tension between dynamic data and static dashboards
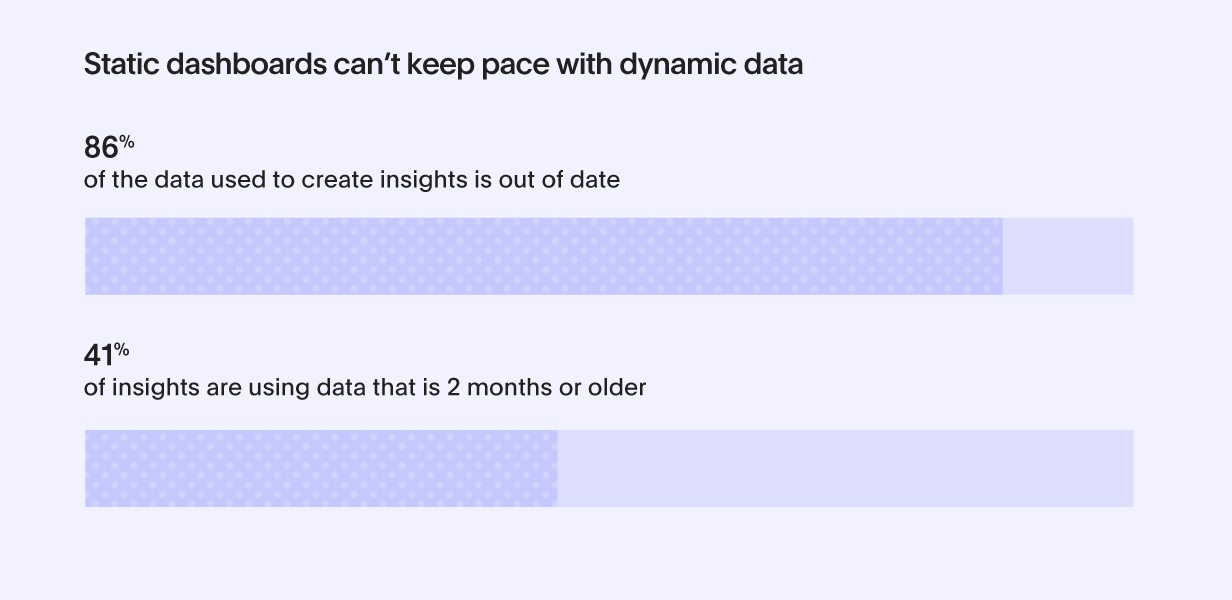
Data is not a static object. It’s a living and breathing entity, constantly changing, trending up or down, leaning left or right, and building upon itself as more and more of it is collected. Dashboards on the other hand are static and flat. They capture a distinct moment in time with pixel-perfect clarity, and then sit on the proverbial shelf, never to be referenced again. Meanwhile, the shelf-life of your data is shrinking exponentially, becoming obsolete in a matter of hours in some cases.
Today’s analysts report that 86% of the data they use to create insights is out of date, with just under half of that data clocking in at two months or older. That means more often than not business users are basing million-dollar decisions on stale data that isn't representative of the current world.
But it’s not just the data points themselves that are always changing, it’s also the underlying scheme of the data, which dashboards simply can’t handle without breaking publishing pipelines.
In the modern world, data schemas change frequently to keep pace with the sheer volume of new data sources. How frequently? Some studies estimate that an average of 60% of data schemas change at least monthly. Every time that happens, even simple changes to a column name, can break the dashboard downstream. This forces data teams to spend hours going through failure logs and work backward to figure out where the problem took place to rectify broken insights.
3. Dashboards keep your data in the dark
Though modern data teams have tried their best to illuminate insights with dashboards, these outdated solutions fail spectacularly at making any kind of dent and are absolutely choking on modern-day data volumes. Need proof? Consider that at any given time, your business is sitting on billions of rows of underutilized or completely unused data in your data warehouse.
Research has shown time after time that this is true. In fact, the latest estimates indicate more than 50% of all your company’s data goes unused. On top of that, 66% of data leaders report that half or more of their organizations’ data is “dark” (e.g. untapped, unknown, or unused) and 57% say the volume of data is growing faster than their organizations’ ability to keep up. As a result, 47% acknowledge their organizations will fall behind when faced with rapid data volume growth, and four in five data leaders cite data volume is the primary challenge in tapping into dark data.
These figures are alarming. Successful organizations need to tap into all of their data to impact bottom line outcomes. Indeed, organizations that operationalize dark data see an average of 5.32% added to their annual revenue and eliminate an average of 4.85% from their annual operational costs.
4. Dashboards can’t keep up with the way your teams work today
Legacy dashboards just can’t deliver consistent and reliable insights at the speed and global scale your team demands. They lack:
Opportunities for collaboration: Desktop dashboard development is done in silos, hindering analyst collaboration.
Discoverability and re-usability: Multiple, disconnected publishing servers, each managed separately and with varying access and permissions controls creates a tremendous amount of analytics waste and operational overhead. Information is lost in a sea of disparate dashboards and servers, and analysts spend valuable time on profitless tasks.
Secure remote data and insight access: Complex pipelines and desktop development make managing access controls a living nightmare for data governance and security teams.
Rapid use-case development with single-touch insight provisioning: Developing new use cases requires months of gathering business requirements, data modeling, and development on top of governance and security validation, creating a compliance, data refresh and publishing nightmare.
All together, these limitations make it impossible for you to implement the sweeping data-driven transformations you’ve planned for your organization. Instead, changes are incremental and business value is nearly imperceptible.
Get more value from your data
In order to thrive in the new digital landscape, you need real-time insights to take real-time actions built on solutions that are going to bring all of your data into the light. And if dashboards aren’t up to the task then it’s up to you to find a better way.


