

If you are responsible for driving adoption of BI and Analytics for your organization, then you understand how difficult it can be to shift an organization to a data-driven mindset. According to one study, BI adoption at organizations is only 35 percent in 2019. It’s not for lack of trying. Rather, business analytics software has historically been too technical for most business users.
At ThoughtSpot, we’ve believed since day one the world needs a new data paradigm to solve this adoption challenge. For data to transform an organization, anyone must be able to find insights and make decisions.
That’s why we’re so excited about ThoughtSpot 6.0. With ThoughtSpot 6.0, we’re introducing a slew of new capabilities and features to make it even easier for everyone in your organization, regardless of their technical chops, to start using search and AI analytics today.
With that in mind, we explored the core adoption loop, from bringing new users into the system to continuously improving the overall organizational fluency with data. In between, our new features help users learn how to make data-driven decisions and inspire more colleagues to join the data journey.
Here are the five distinct steps of adoption, and new capabilities in ThoughtSpot 6.0 to drive engagement at every step of the way.
Step 1: Onboard
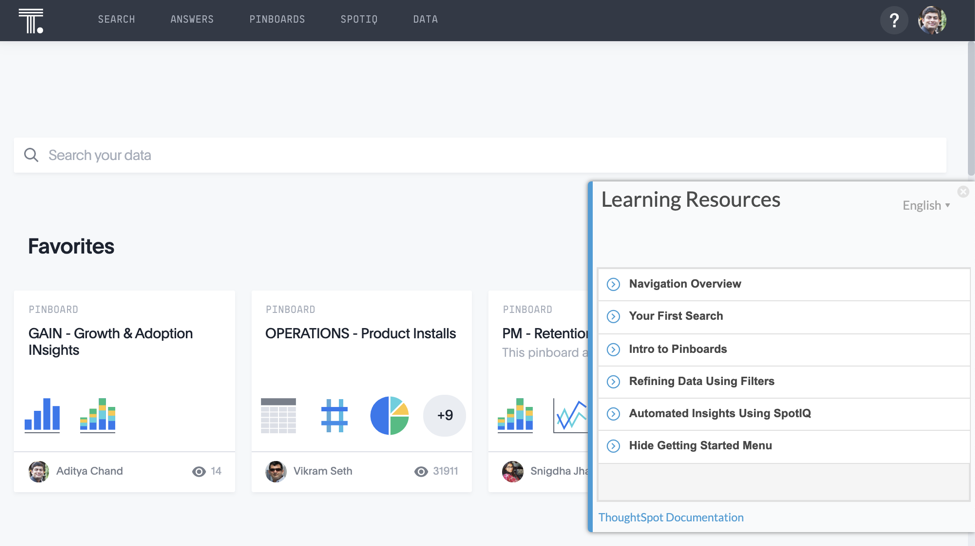
Have you ever heard the phrase “you never get a second chance to make a first impression”? The same holds true for analytics. One of the most critical moments for BI adoption happens during the onboarding process. Many users quickly make a judgement about a tool’s ease of use. That judgement will determine whether or not they will continue to engage with it.
Our new Getting Started section gets users up and running in minutes. We have added short introductory videos for users when they use ThoughtSpot for the first time. These learning resources answer common questions like, “What is SpotIQ?” or “How do I create my first search?”
We believe this proactive approach to in-context training will increase adoption significantly and decrease the overall cost of onboarding.
Step 2: Consume
When you consume any social media like Twitter, you don't just want to learn about new tweets only when you log in. You want Twitter to push the most important stories to you, so you know when to dig in and explore more.
Similarly, ThoughtSpot’s AI engine - SpotIQ can now monitor any metric for you and notify you of changes you deem important. What’s more, these notifications will come to you via email without you even needing to visit your ThoughtSpot dashboard. Simply follow a metric you care about, and start receiving trends, outliers, forecasts, and more.
Step 3: Tinker
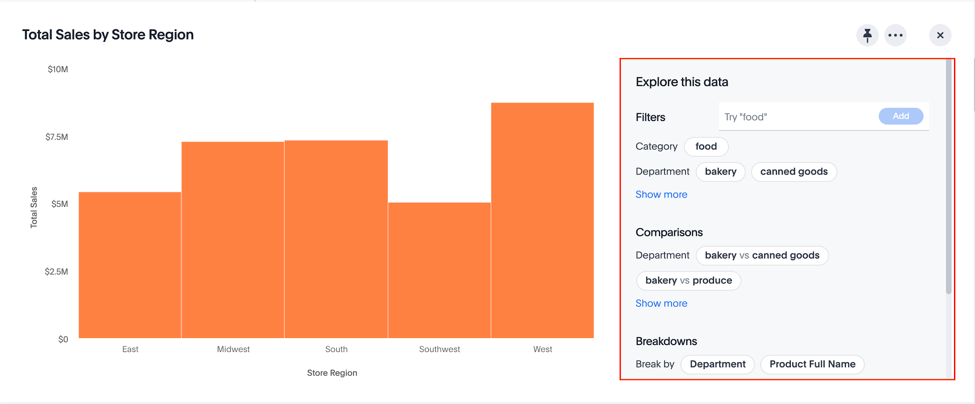
The most interesting discoveries are often the result of exploration without a specific goal in mind. The same is true of data exploration. Business users need more options to tinker -it’s the key to finding that eureka insight and unlocking new business opportunities.
That’s why we now support AI-guided data exploration with no hierarchy or pre-defined paths. With one click, users tinker with the data and go through a self-guided exploration, bringing us closer to our product goal of Less Input More Output #LIMO.
Users get suggestions to add or replace filters, and breakdown or compare data. These recommendations are based on the current chart being viewed, relative priority of the columns, and user behavior. You will love it for its ease of use. We have seen our users’ eyes light up when they see a recommendation that they were already looking for.
Step 4: Create
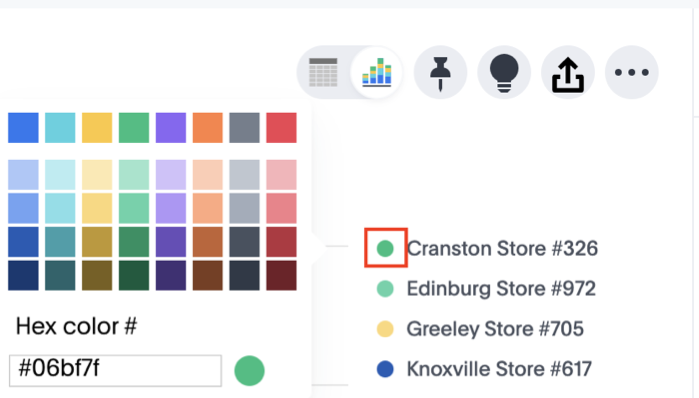
Often, the most effective way for business users to communicate their findings is through a good visualization. How effective can this communication be, however, if business people don’t have the flexibility to tell the story just right? We know users want complete control in how they visualize their data, and now, we’ve made it easier for anyone to modify charts and graphs.
We are excited to announce that in the 6.0 release you can:
Easily configure labels and axes
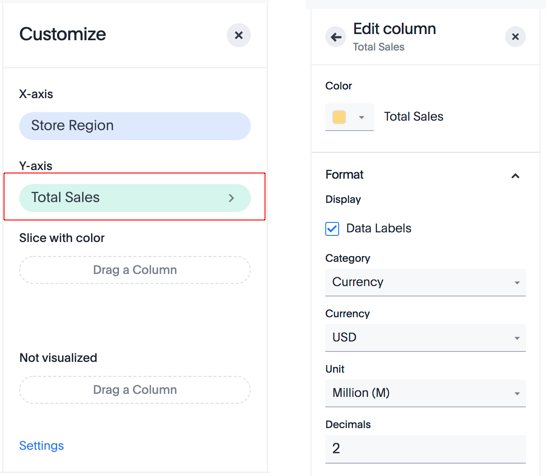
2. Design using simple drag-and-drop UX
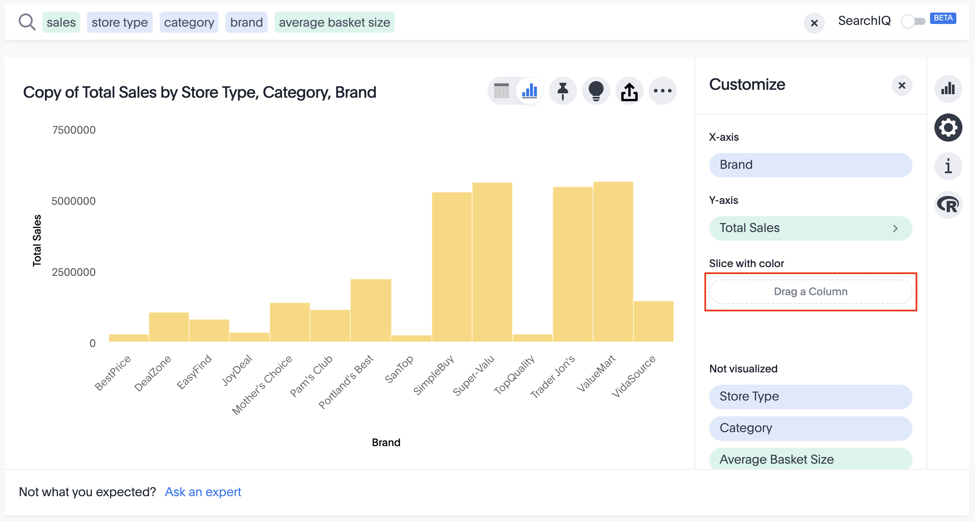
3. Change legend color
Step 5: Amplify
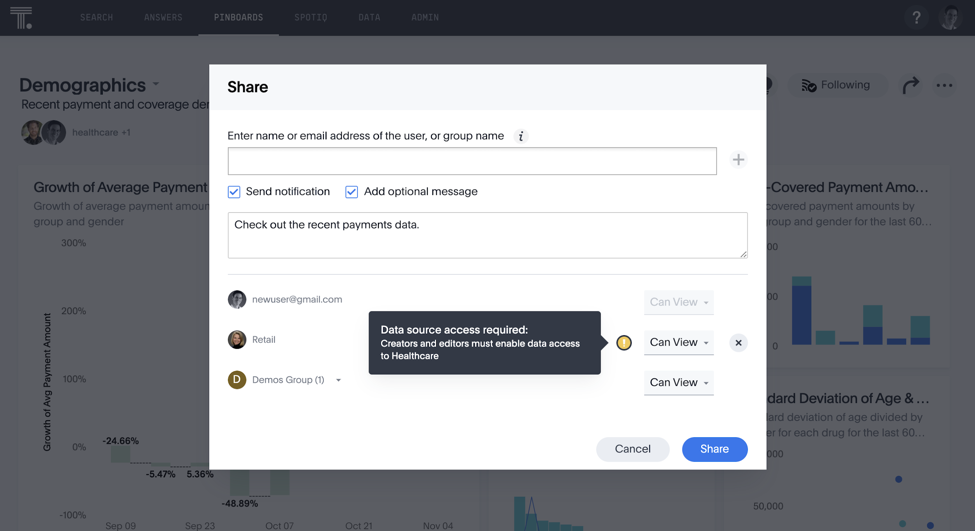
When users conduct analyses in isolation with no feedback, there’s a risk their work won’t deliver maximum value to the broader organization. Just like other areas of business, analytics benefits from collaboration.
6.0 aims to make data analysis a collaborative discipline through the availability of a simplified sharing mode. Once a user creates an insight, they can amplify their learnings across the organization.
Sharing provides multiple organizational benefits including:
Decrease in business users doing redundant work in isolation
Increase in collaboration and idea sharing
Motivation for skeptical team members to adopt BI
Users can now invite people with whitelisted domains, easily see their access levels for a pinboard, and request access.
Bonus #1 for Admins: Scriptable Worksheets
You didn’t think we forgot about admins in 6.0, did you? Admins are the superheroes who keep the ThoughtSpot engine humming. We have made their lives easier using Scriptable Worksheets. They can now bulk update the metadata associated with objects by exporting the metadata in YAML format, modifying it, and then importing it into either the same or a different cluster.
This will allow admins to:
Easily export objects like Worksheets and Pinboards from the development to production environment
Make complex changes not possible through the UI, like replacing a column from one table with a column in another table
Bonus #2 for Admins: Snowflake connector using Embrace
Customers love using Snowflake Data Warehouse and so do we. We now support live query on Snowflake databases making it easy for admins to:
Setup and Deploy ThoughtSpot
Eliminate the need to move data into ThoughtSpot for analysis
Centralize data management and governance in Snowflake
We believe that ThoughtSpot 6.0 will boost user engagement and adoption of analytics in your organization. So, what are you waiting for? Try out our 6.0 release and engage with our brilliant product managers and engineers on the ThoughtSpot community.
For a live tour of the release, join us for a webinar.


