- A Venn diagram sorts items by set membership, so you can see what belongs to one group, several groups, or none of them.
- The overlapping area is the intersection. Count it once when you calculate the total number of items in either set.
- For three sets, start with the center shared by all three, then work outward through pair-only and single-only regions.
- Use a Venn diagram for category overlap. Choose another chart when you need to compare magnitude, trends, or numeric relationships.
Overlapping groups can make a simple total surprisingly easy to get wrong. If you add every group without accounting for shared members, you count the same people, products, or outcomes more than once.
Venn diagrams give you a clear way to organize that overlap. The examples below show how to read two-set and three-set diagrams and apply the core formula. You will also learn how to check your work and choose another visualization when needed.
What Two-Set Venn Diagram Examples Show
A Venn diagram uses overlapping shapes, usually circles, to show how sets relate. A set is a collection of items that meet a stated condition. Examples include customers who opened an email or students who joined a club.
The rectangle around the circles represents the universal set, meaning every item under consideration. The OpenStax guide to Venn diagrams describes circles or ovals as events. Their intersection contains items in both sets, while their union includes items in either set, including the overlap.
Here are the regions you need to recognize:
Set A only contains items in A but not B.
Set B only contains items in B but not A.
The intersection contains items shared by A and B.
The union contains every item in A, B, or both.
The complement of A contains everything in the universal set that is outside A.
The neither region contains items outside both A and B.
Each item should land in one region of the completed diagram. That rule keeps your categories separate and makes the final count easier to check.
Two-Set Example: Marketing Campaign Reach
Suppose you have a hypothetical audience of 1,000 contacts. An email campaign reached 420 contacts, a social campaign reached 310, and 140 contacts saw both campaigns.
Start with the overlap because those 140 contacts are included in both campaign totals. Once you place that number in the intersection, calculate the exclusive regions:
Email only: 420 − 140 = 280
Social only: 310 − 140 = 170
Both campaigns: 140
Now add the three non-overlapping regions inside the circles: 280 + 140 + 170 = 590. That result is the union, or the number of contacts reached by at least one campaign.
To find the contacts reached by neither campaign, subtract the union from the universal set: 1,000 − 590 = 410. Your completed regions are 280 email only, 140 both, 170 social only, and 410 neither.
Why not add 420 and 310? That calculation gives 730 because the 140 shared contacts appear in each original total. Subtracting the intersection once corrects the double-counting: 420 + 310 − 140 = 590.
A quick check should return the universal total. Add every separate region, including neither: 280 + 140 + 170 + 410 = 1,000.
How to Solve Two- and Three-Set Venn Diagrams
Whether your diagram has two sets or three, the safest method is to fill the most specific overlap first. If you begin with a large set total, you can accidentally place shared items twice and carry the error through every later calculation.
Use this process:
Define the universal set. Write down the complete population and its total, if one is provided.
Name each set. State the condition that puts an item inside each circle.
Place the deepest overlap first. In a two-set diagram, that is the intersection; in a three-set diagram, it is the center shared by all three.
Work outward. Calculate pair-only regions before the single-only regions.
Find the union. Add the separate regions inside the circles.
Calculate neither. Subtract the union from the universal total.
Check every region. Their sum should match the universal set.
When you draw the diagram, keep the original totals beside the circles until every region is filled. This gives you a reference during subtraction and makes your final review faster. If a region produces a negative number, revisit the source counts because at least one total is inconsistent.
Labels matter as much as arithmetic. Write the set condition near each circle, include the reporting period, and state whether pairwise totals include the center. Those notes prevent a correct calculation from being read as a different comparison later.
For two finite sets, the inclusion-exclusion principle from the University of Notre Dame gives the formula:
n(A ∪ B) = n(A) + n(B) − n(A ∩ B)
In plain language, add the total in A to the total in B, then subtract the shared count once. The same source explains that a three-set diagram divides the universal set into eight separate regions, including the area outside all three sets.
Three-Set Example: Customer Segment Overlap
Consider a hypothetical group of 250 customers. You want to compare three forms of engagement: product use, training attendance, and community participation.
The totals are:
120 customers use the product.
90 attended training.
80 participate in the community.
45 use the product and attended training.
35 use the product and participate in the community.
30 attended training and participate in the community.
15 belong to all three sets.
Begin with 15 in the center. The pairwise totals include those 15 customers, so subtract the center to find each pair-only region:
Product and training only: 45 − 15 = 30
Product and community only: 35 − 15 = 20
Training and community only: 30 − 15 = 15
Next, calculate each single-only region. For product only, subtract every product region already placed: 120 − 30 − 20 − 15 = 55.
Follow the same pattern for the other sets. Training only is 90 − 30 − 15 − 15 = 30, while community only is 80 − 20 − 15 − 15 = 30.
You can now add the seven regions inside the circles: 55 + 30 + 30 + 20 + 15 + 15 + 30 = 195. Since the universal set contains 250 customers, 250 − 195 = 55 customers belong to none of the three engagement groups.
Check the finished diagram by adding all eight regions. The sum should be 250, which confirms that every customer appears once.
Three-set problems look busy because several totals include the same center. When you move from the center outward, each subtraction has a clear purpose, and the final check can catch a misplaced count.
If your source data lists individual customers, assign each person a yes or no value for each set before counting the regions. That simple table gives you an audit trail, especially when a customer’s membership changes between reporting periods.
When Venn Diagrams Fit Business and Data Questions
Venn diagrams are useful when your question asks which items belong to which groups. You might compare campaign audiences, customers using several features, or products purchased across categories. Employee program enrollment is another good fit.
The method works best when each set has a precise rule. “Customers who used feature A in the past 30 days” is clear, while “highly engaged customers” needs a measurable definition before you draw the circles.
Questions a Venn Diagram Can Answer
A small Venn diagram can help you answer practical membership questions such as:
Which customers use both feature A and feature B?
Which leads responded to email, paid social, or both?
Which students joined one activity but not the other?
Which accounts bought either product category?
Which participants belong to none of the selected groups?
These questions focus on inclusion, exclusion, and overlap. Because every region represents a category, you can compare the groups without assuming that one variable causes another.
Keep the number of sets small enough to read. Two circles are often the clearest choice, while three circles can work when the center and pairwise overlaps matter. As you add more sets, the regions become harder to label and explain.
Questions That Need Another Chart
A Venn diagram cannot show whether two numeric measures rise together or how a metric changes over time. It also offers limited precision when you compare category sizes. For those questions, choose a chart built around position, length, or a shared numeric scale.
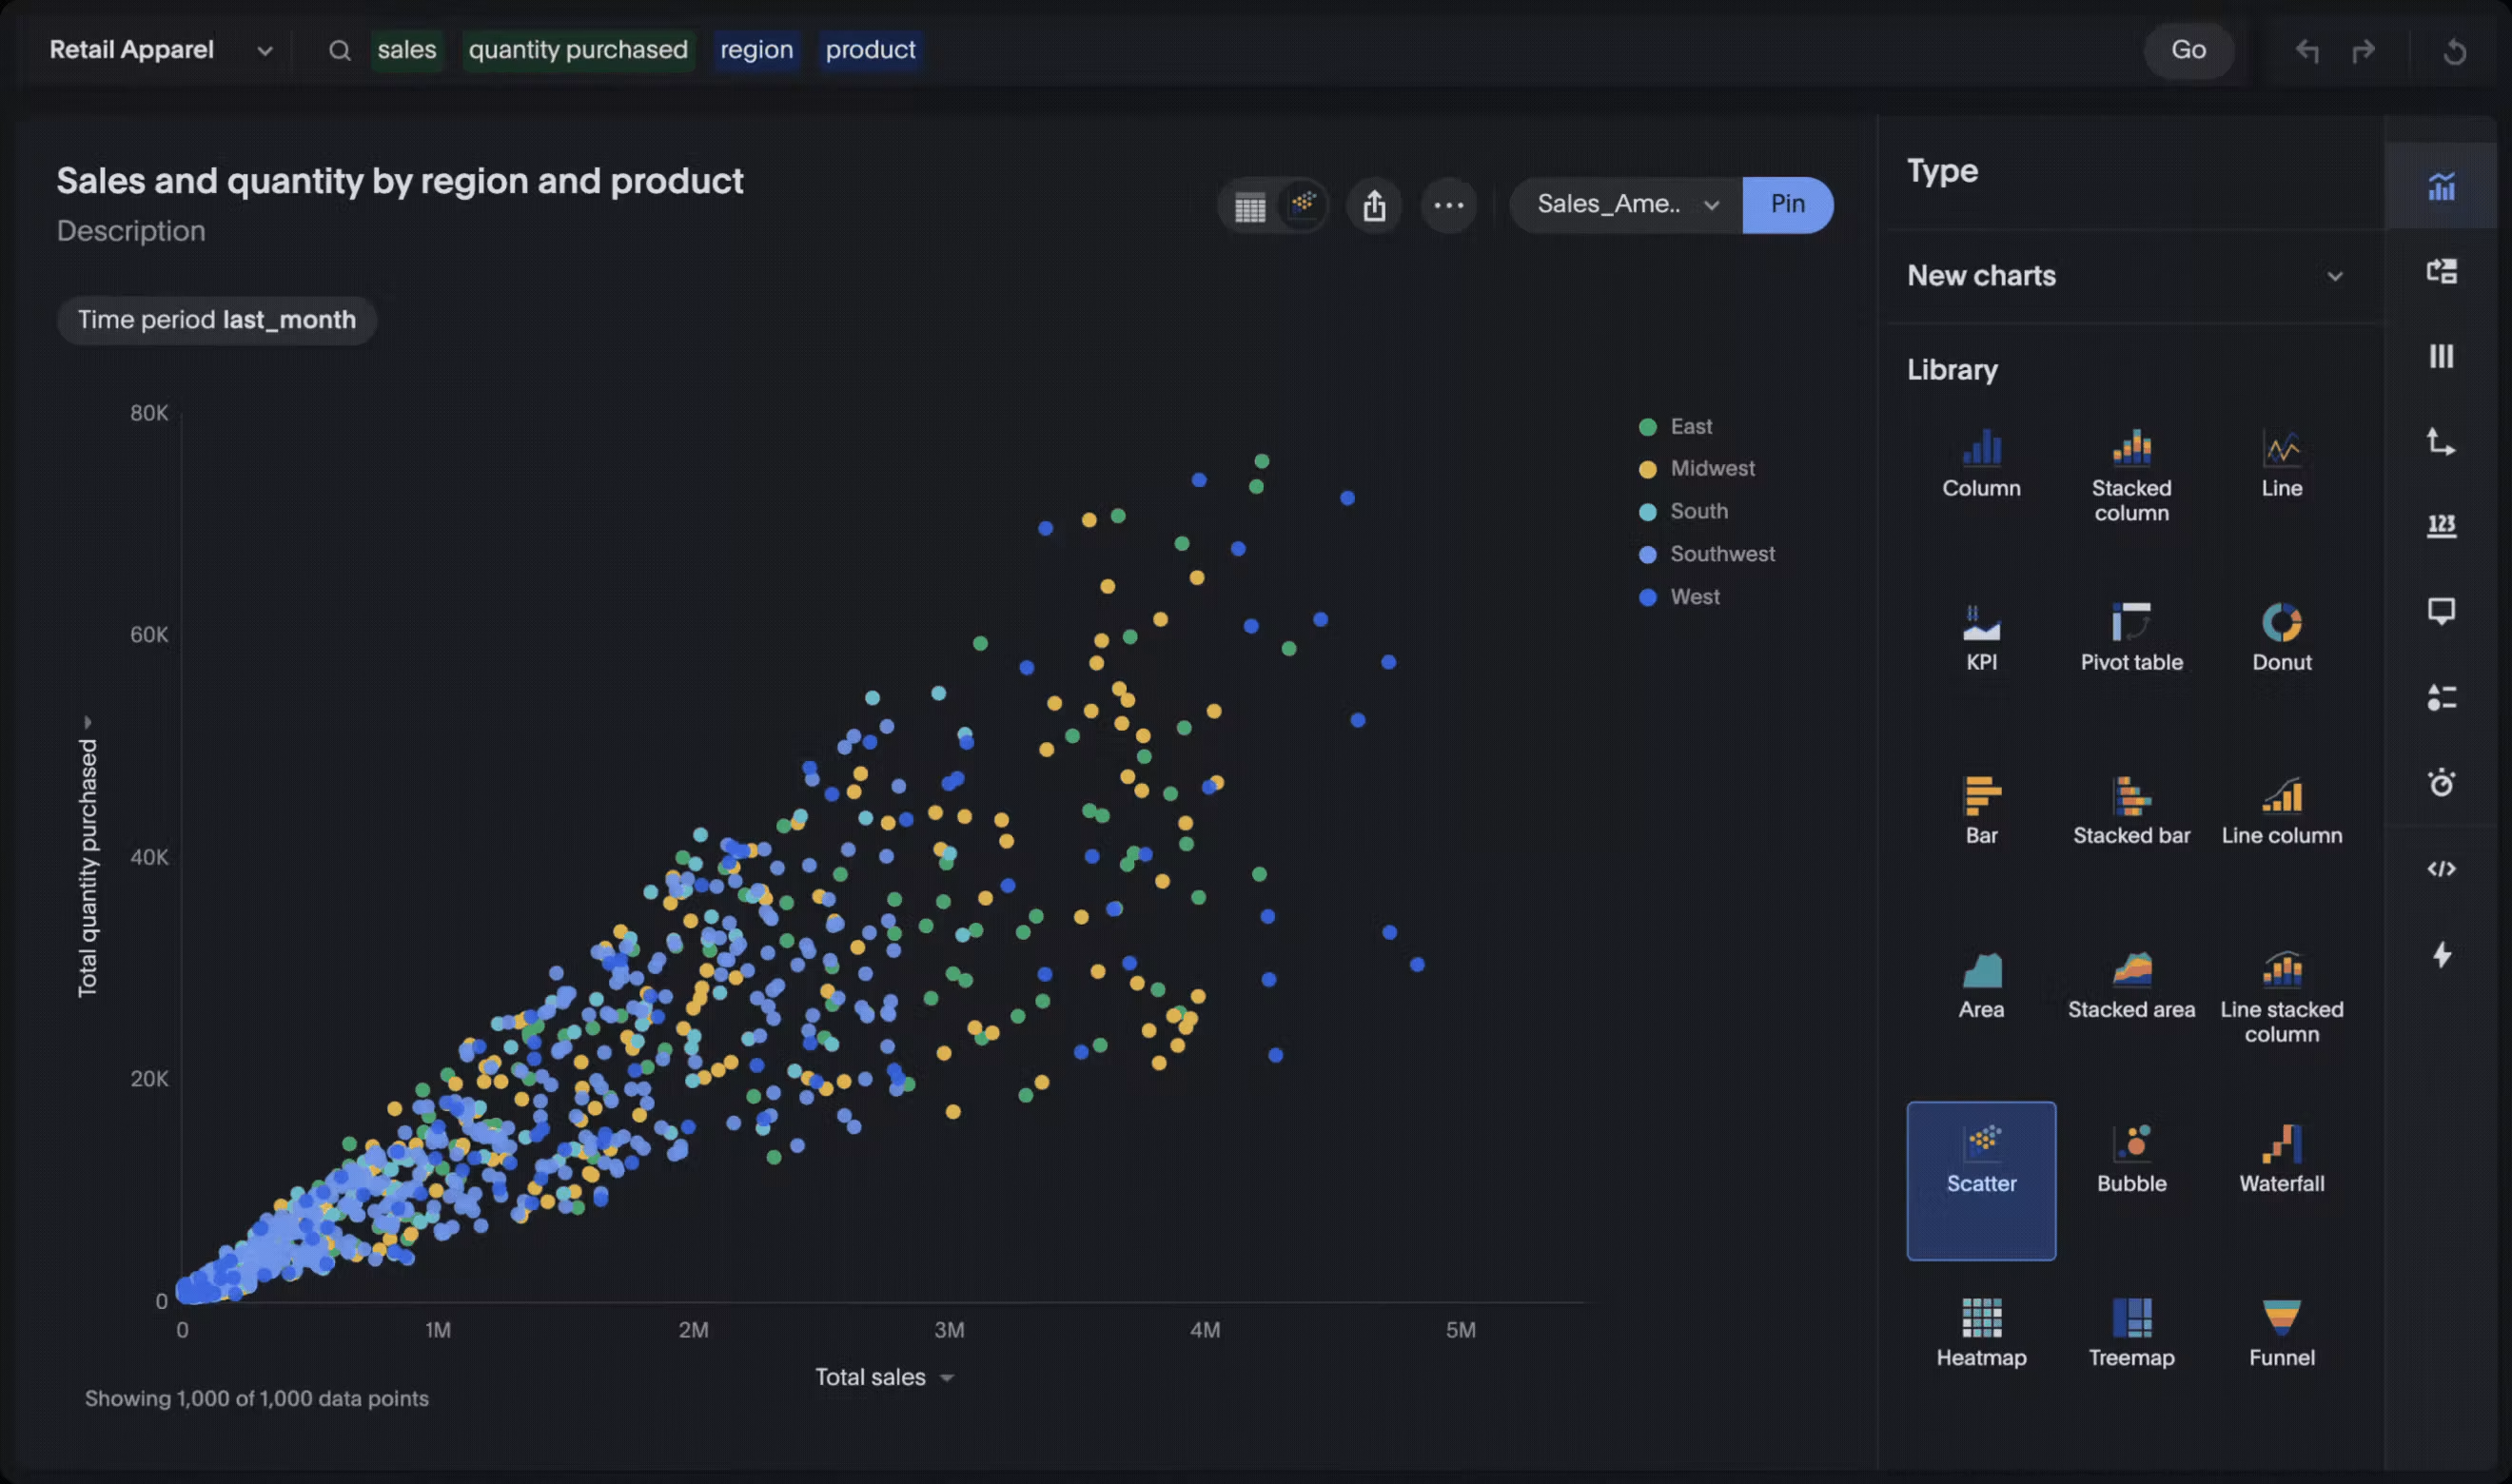
Use a scatter plot to examine the relationship between two measures, such as purchase quantity and total sales. A line chart suits changes over time, while a bar chart makes category sizes easier to compare. You can review more interactive data visualizations when your question goes beyond set membership.
This distinction matters because category overlap and numeric correlation answer different questions. A customer can belong to the “uses mobile” and “uses desktop” sets. However, the circles cannot show whether more mobile sessions correspond with higher order values.
Before choosing a visual, write your question as a sentence. If it asks who or what belongs to several categories, a Venn diagram may fit. If it asks how much, how fast, in what order, or how two measures move together, use another chart.
Choose the View That Matches Your Question
The best Venn diagram examples make one idea visible: where membership overlaps. Define your sets carefully, place the deepest intersection first, work outward, and check that every separate region adds back to the universal total.
When your question concerns magnitude, sequence, trends, or correlation, switch to a visualization designed for numeric comparison. That choice keeps the chart aligned with the decision you need to make.
To ask questions of business data and review different views, explore enterprise analytics from ThoughtSpot, the Agentic Analytics Platform.