- A gauge chart shows one current KPI against a defined scale, target, or threshold.
- Use a gauge when status matters more than comparison, history, ranking, or distribution.
- Set meaningful endpoints, visible values, defensible thresholds, and accessible cues beyond color.
- Choose a bar, line, bullet chart, or KPI card when readers need comparison, trends, density, or small-screen clarity.
- Pair a gauge metric with interactive detail so readers can investigate a status change and decide what to do next.
A gauge chart is a dial-like visual that shows one current measure against a known range. It works best when someone needs a fast answer to “Are we on track?” plus enough context to understand what the number means.
You may also hear it called a gauge graph, dial chart, or meter chart. Whatever the label, the fit depends on the question, the scale, and the action tied to each status range.
What Is a Gauge Chart?
A gauge chart places a current value on a minimum-to-maximum scale. The display can be circular, semicircular, or linear, with a pointer, filled arc, marker, or bar showing the present position.
The University of Nevada, Las Vegas describes gauge chart basics in terms of speedometer-like displays and defined performance benchmarks. Those benchmarks often divide the scale into states such as poor, acceptable, and good.
A useful gauge has four parts:
Current value: The exact KPI reading, shown as a number and visual position.
Scale: The visible minimum, maximum, units, and direction of improvement.
Target or threshold: The goal or boundary that changes the status and prompts action.
Context label: A plain-language metric name, time period, and scope.
Suppose monthly recurring revenue reaches 82% of its target. A gauge could show 82% as the current value, 0% and 100% as endpoints, and defined ranges for at risk, watch, and on track.
That display answers a status question. It does not show whether revenue improved for six straight months, how regions compare, or which customer segment drove the result.
When a Gauge Chart Helps, and When Another Chart Wins
Start with a simple fit test: Do you have one metric, one audience question, and a credible target or threshold? If any answer is no, another dashboard visualization will probably communicate the information more clearly.
Gauge charts favor rapid status monitoring. Comparative and historical analysis need visual forms that make differences, order, and direction easier to see.
| Chart | Choose When You Need | Watch For |
|---|---|---|
| Gauge chart | One KPI against a range or target | Limited comparison and history |
| Bullet chart | Progress against a target in limited space | Add a clear label for unfamiliar readers |
| Bar chart | Category comparison, ranking, or variance | Add time context when direction matters |
| Line chart | Trend, direction, or seasonality | Add target context when status matters |
| KPI card | One exact value in little space | Add target or trend context |
Nielsen Norman Group explains the limits of angle encoding, noting that angle communicates quantity poorly.
For dense KPI dashboards, choose compact bullet charts when you need to compare current progress with a target in limited space.
Choose a Gauge for One Decision-Ready Status Signal
A good gauge chart connects a defined KPI state to a decision. Why does that connection matter in enterprise business intelligence? A polished dial is only useful when people trust the metric and know how to respond.
Common gauge chart examples include:
Sales attainment: Show progress against a monthly quota, with an agreed cutoff for escalation.
Service performance: Show results against a contractual threshold, with clear units and reporting periods.
Budget consumption: Show spending against a fixed limit, with a warning range before the limit is reached.
Inventory capacity: Show current usage against a safe operating range, with an owner for corrective action.
Each example needs a shared definition. Treat governed data for leaders as an operating requirement by documenting the formula, source, scope, and action rules.
Avoid adding a gauge simply because a metric has a target. Ask whether the target is stable, whether the range is meaningful, and whether the status will change a decision.
Use a Bar or Line Chart When Comparison or Change Matters
Use a bar chart when readers need to compare regions, products, teams, or categories. Use a line chart when direction, volatility, seasonality, or a change point matters more than the latest value.
A set of repeated status metrics often works better as bullet charts or compact KPI cards. When readers need to compare several statuses, choose those compact alternatives instead of a row of dials.
Choose the chart based on the analytical question you need to answer. A gauge addresses current status, while advanced visual analysis may call for comparisons, distributions, relationships, or trends.
Before publishing, test two views with representative readers. If they immediately ask “compared with what?” or “how did we get here?” add the needed context or switch charts.
Design a Gauge Chart That Readers Can Trust
A gauge can mislead when its scale is arbitrary, its target is hidden, or its threshold logic is unexplained. A narrowed range can also make a modest movement look dramatic, especially when scales change across related gauges.
Use this checklist before a gauge reaches a KPI dashboard:
Fix and show endpoints: Display a defensible minimum and maximum, then keep them consistent where comparison is expected.
Write a plain-language title: Name the metric, period, and population without internal shorthand.
Display the current value: Do not make readers estimate a number from the pointer or arc.
Justify every threshold: Tie each band to an operating rule, objective, or documented risk level.
Restrain color: Use color to reinforce status rather than decorate the chart.
Add context when needed: Place a trend, prior-period value, or comparison near the gauge.
Accessibility belongs in the chart design, not in a later cleanup pass. The W3C color guidance states that color cannot be the only visual method for conveying information or distinguishing an element.
Make the Scale and Thresholds Do Real Work
Start with the business rule, then configure the gauge range. Decorative red, amber, and green bands can suggest precision that the underlying metric definition does not support.
Document these scale choices:
Minimum and maximum: Explain whether they are physical limits, policy limits, goals, or expected operating bounds.
Target: Show the value that defines success and who approved it.
Thresholds: State why each boundary changes the status or required response.
Units: Keep percentages, currency, counts, duration, and rates visible.
Overflow behavior: Decide how the chart shows a value above the maximum or below the minimum.
Zero crossing: Use extra care when a metric can move from negative to positive values.
For a support response-time gauge, a team might mark above 60 minutes as red and 30 to 60 minutes as amber. Below 30 minutes could be green, but only when that mapping reflects the team’s documented service objective.
The metric also needs a stable source and documented governance. As teams connect governed data, they should record the source, owner, and refresh timing beside the KPI definition.
Keep the Visual Readable and Accessible
Color should confirm a status that readers can also identify through text, labels, icons, patterns, or marker shapes. Show the exact value and target so the meaning remains available to people who cannot distinguish the chosen colors.
For a small screen, simplify the arc and remove unnecessary tick marks. Keep the current number prominent, use short labels, and preserve enough space for touch and reading.
There is no universal number of gauges that fits every dashboard. When repeated dials make comparison difficult, replace them with KPI cards, bullet charts, or a sorted bar chart.
How to Build a Gauge Chart for a KPI Dashboard
Building a gauge starts with the decision, not the arc. Follow this five-step process to keep the chart grounded in a trusted metric and a clear audience need.
Choose the metric and decision. Write the question the gauge must answer and the action each status should prompt.
Document the formula and source. Record the calculation, grain, filters, owner, refresh timing, and governed data source.
Set the range and target. Define the minimum, maximum, target, and thresholds from business rules.
Configure clear signals. Add the exact value, units, labels, and a second cue beyond color.
Test another chart. Compare the gauge with a bar, bullet chart, or KPI card before publishing.
The last step prevents chart habit from becoming dashboard policy. A guide to conversational data analysis can also help teams plan how readers will move from the initial KPI signal to a more specific question.
Test the finished gauge with someone who uses the metric but did not build the chart. Ask what the value means, whether action is required, and which question they would ask next.
Pair Status With a Path to the Why
A gauge should open an investigation rather than end one. When a KPI enters a warning range, which segment changed, what does the trend show, and is the issue isolated or broad?
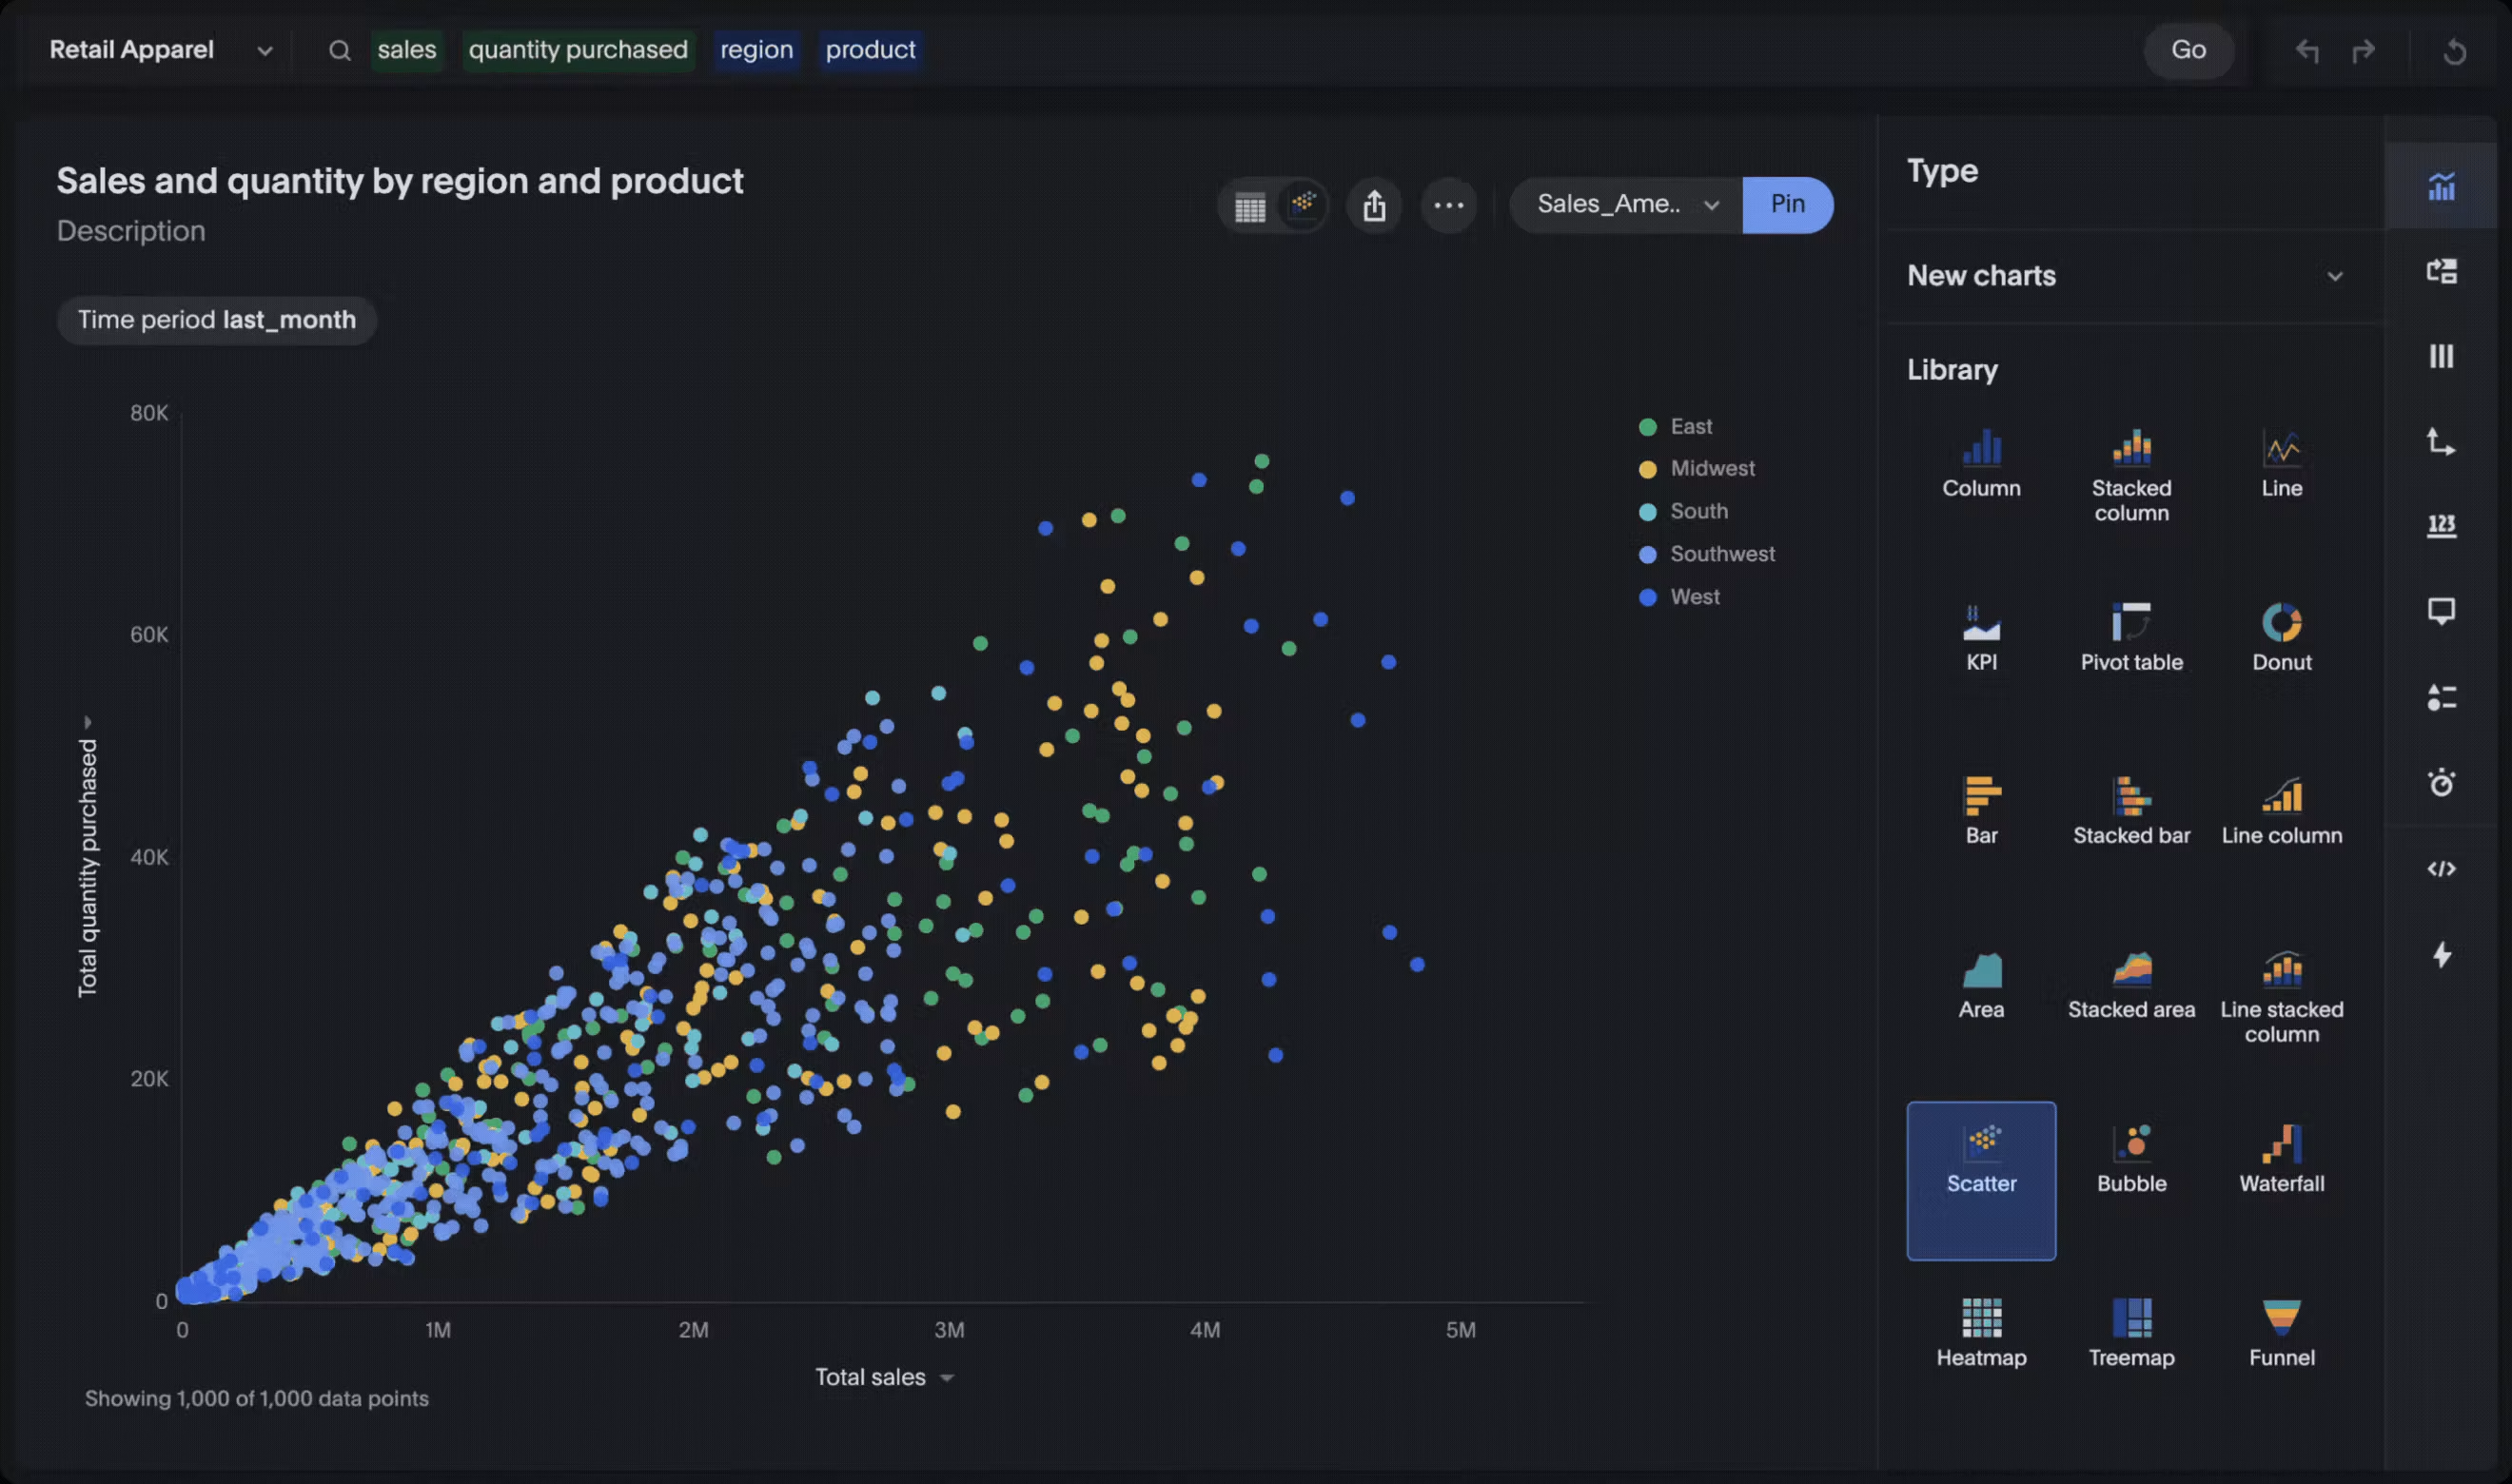
ThoughtSpot offers 25+ native chart options, and analysts can add visualizations to Liveboards. Liveboards are interactive and support drill-down, giving readers a way to drill into dashboard details after a status signal changes.
Keep the alert close to the analysis. Let people continue from the KPI into the supporting detail, compare relevant periods, and inspect the segments behind the change.
Which governed metric definition or filter shaped the result? The surrounding dashboard should give readers a clear, practical path from the gauge to that next question before making a decision.
Make Your KPI Status Useful, Not Just Visible
Use a gauge chart when one current metric needs a clear, action-oriented status readout. Give readers a visible range, exact value, credible target, and threshold logic they can explain.
When comparison or change is the real question, choose a bar, line, bullet chart, or KPI card. When a gauge is the right fit, pair it with trend and detail views so people can investigate rather than just observe.
Pair clear KPI status with interactive analysis when you see ThoughtSpot in action.