


Recently, I published an article on whether self-service BI is attainable, and spoiler alert: it certainly is. Of course, anything of value usually does require a bit of planning, collaboration, and effort. After the article was published, I began having conversations with technical leaders, analysts, and analytics engineers, and the topic of data modeling for self-service analytics came up repeatedly. Questions like:
How do we model data for self-service analytics by non-technical users?
Do we need special modeling techniques for search-based or NLP analytics?
So, here are some technology and process-focused tips and tricks that can help analysts and engineers model their data for self-service analytics.
4 data modeling best practices for data and analytics engineers
Build a shared understanding of the business
Try spending a day in the life of a customer, taking on the critical frontline activities of your business users. It will give you an in-depth understanding of the business and uncover hidden value for the organization. These can be done in groups, teams, or individually. Sure, it will take some time, but the investment is well worth it. This is not just about better requirements but about gaining a shared understanding of the business.
As a data delivery leader at AAA, I was known for listening in on sales calls, riding in tow trucks at 5 am, working the front counter in service centers, and taking customer support calls. You’re probably thinking, “OMG, I’m glad I didn’t work as a data analyst on your team!” But, these experiences created a shared understanding with the business leaders that cannot be captured in a requirements document or even a descriptive conversation. On a recent Data Chief Podcast, Chris Powers of Citigroup shared, “Sometimes clients know what they want, but they don't know how to ask for it.” The key here is to stay curious and stay in touch with what’s happening on the frontline1.
Whether you are a data engineer, analytics engineer, or analyst, you should view your role as an enabler for the business, not just an order-taker.
Yes, delivering data and insights is valuable, but your business users also want to trust that you know and understand their work. So make sure that you do, and soon your business partners will become your best friends.
Avoid spending too much time on premature optimizations
“The real problem is that programmers have spent far too much time worrying about efficiency in the wrong places and at the wrong times; premature optimization is the root of all evil (or at least most of it) in programming”2, according to leading computer scientist Donald Knuth. And while Knuth wrote this in the 1960s, it is still true today. Analytics and data engineering may not be repeating the history of the 1960s computer science era, but it’s definitely rhyming with it.
I’m not arguing against optimization; far from it. I am recommending that data and analytics engineers change their approach by focusing on the critical 3%, not the 97% of sub-par opportunities. A good analytics engineer will not only deliver quality data and follow best practices; they will identify the most critical components, use measurements to identify issues, and avoid uninformed judgments or jumping to conclusions.
Some best practices to keep in mind:
Optimize for your business users, not yourself. As data engineers and analysts, we often optimize for ourselves either to prove that the solution exists or works, to make our lives easier, to save ourselves time, or to reduce our efforts. I’m definitely guilty of this offense, and I’ve seen others do it as well. The greatest strength of most technologists is our ability to see and discover solutions, but it’s also our greatest weakness. So, ask yourself a few hard questions
Is this a crucial part of the code or data pipeline?
Is this performance optimization needed by my stakeholder or for myself?
What are the tradeoffs between best practices and custom optimizations?
Strive for simplicity! Many data and analytics engineers struggle between building the perfect solution and the required one. A classic example is a start-up company modeling for petabytes of data, millions of user queries, and real-time analytics when they only have megabytes of data, tens of users, and daily integrations. Sure, if the start-up becomes the new big thing, they will need a better solution, more optimizations, and the complexity that comes with it. But right now, the business needs actionable insights on attracting new customers and retaining them, so remember the KISS principle (keep it simple stupid).
Know what you are optimizing for. It is not uncommon for data model optimizations to have multiple goals and competing advantages and disadvantages. Make sure you know the tradeoffs and why you are optimizing. Every situation is different, but below are concepts to consider but definitely not an exhaustive list.
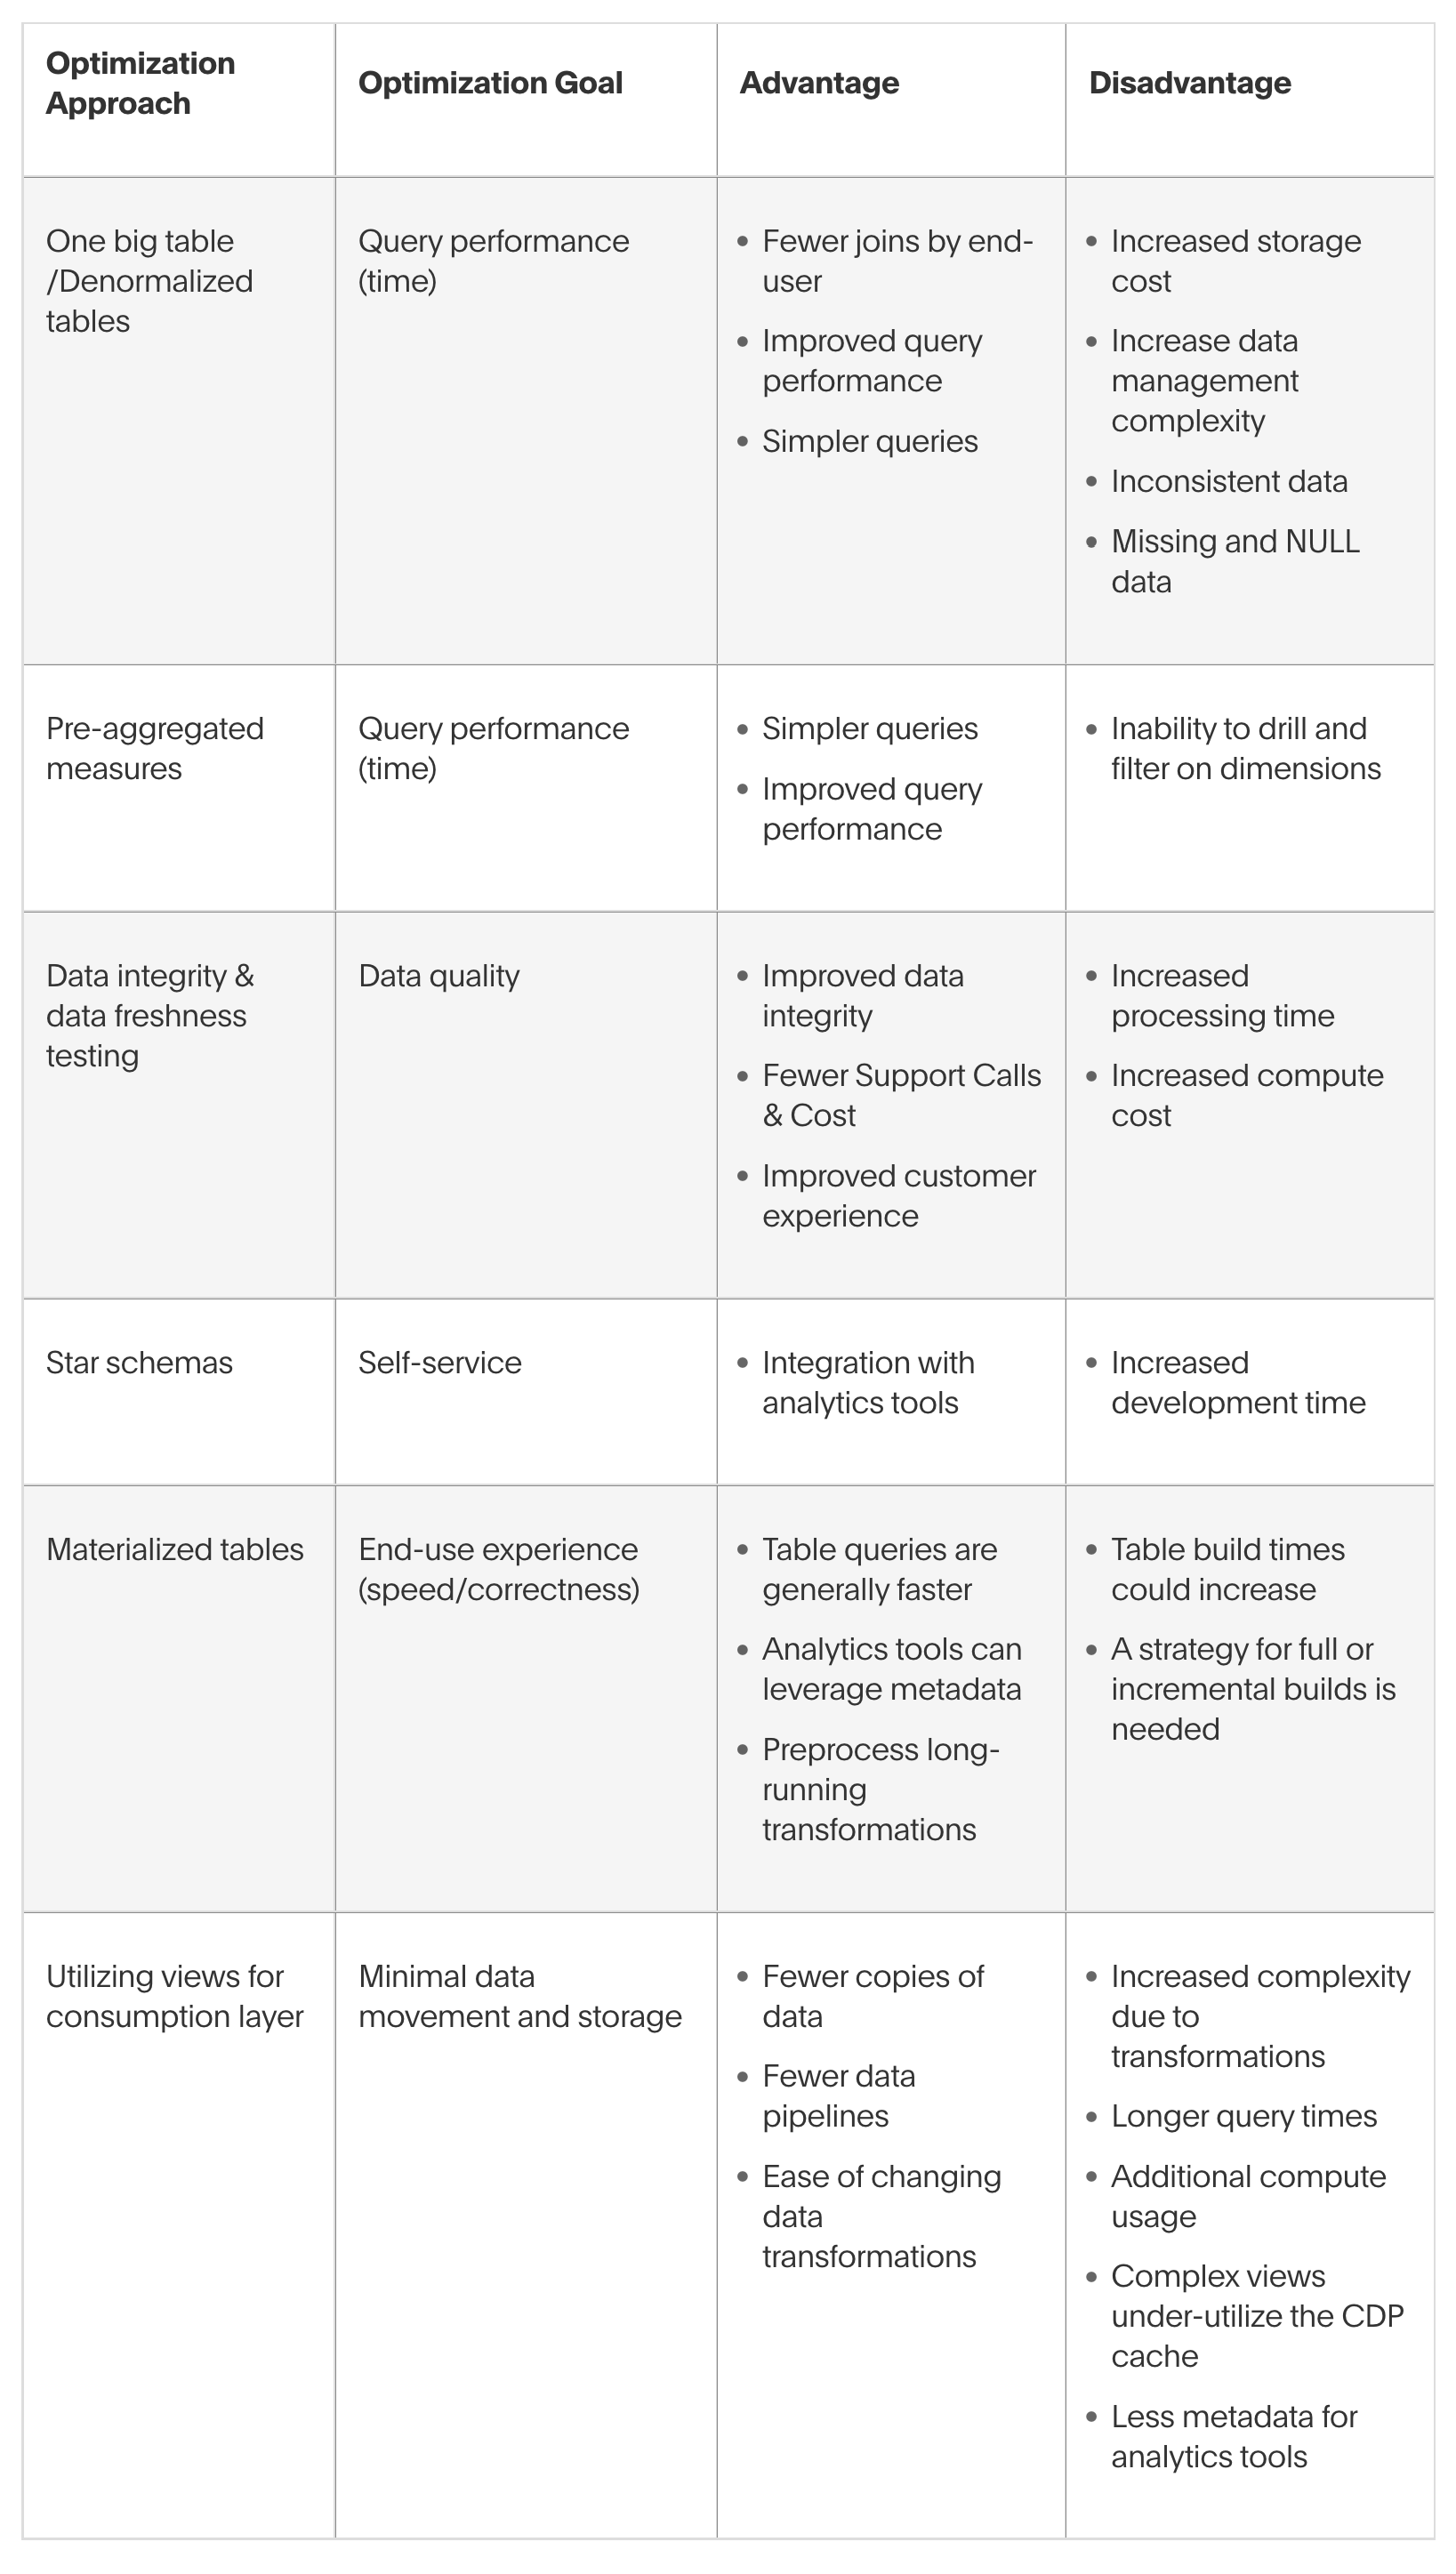
|
Optimization Approach |
Optimization Goal |
Advantage |
Disadvantage |
|
One big table /Denormalized tables |
Query performance (time) |
|
|
|
Pre-aggregated measures |
Query performance (time) |
|
|
|
Data integrity & data freshness testing |
Data quality |
|
|
|
Star schemas |
Self-service |
|
|
|
Materialized tables |
End-use experience (speed/correctness) |
|
|
|
Utilizing views for consumption layer |
Minimal data movement and storage |
|
|
Avoid the one-big-table (OBT) approach whenever possible
OBTs are often chosen for the perceived simplicity and similarity of working with data in a grid or Excel. While OBTs perform well on simple aggregates, they begin to break down when more complex aggregates are required. However, the OBT approach is often coupled with optimizing for the wrong things at the wrong time.
Let’s look at some challenges:
Scale is the problem with OBTs; while quasi-static data with few columns works well, large datasets with many columns won’t scale. Unfortunately, I’ve seen OBT with 250+ columns! Consider this, large OBTs are not actually easier for a business user to navigate because it puts a necessary cognitive burden on them. I call this cognitive callousness.
Creating a single table from multiple disparate datasets or tables often results in duplicate data, NULL data, and a loss of data granularity.
Maintaining data integrity is a huge problem with OBTs due to duplicate and missing data. This includes rebuilding and updating tables.
Modern cloud data platforms (CDPs) are usually columnar and provide scalability with respect to the number of rows, but they begin to slow down as columns increase.
Query complexity is increased with anything beyond simple aggregation, mainly due to the complexity of missing data, NULL data, and duplicates.
Lastly (however, I could go on), try joining data from another fact table. You will soon see that your aggregates are all wrong. This is because of the duplicates and the cartesian product of many-to-many relationships.
So, what is the solution? Use a star schema for your analytics consumption layer with any initiative that has ongoing analysis or is more complex than an old-school static report.
🧠 Curious about how star schemas compare to other approaches? Check out this guide on Star Schema vs Snowflake Schema—and understand which is right for your data modeling strategy.
Use a star schema for your analytics models
Dimensional Modeling (DM) is a data modeling technique for your analytics warehouses. The typical artifact of DM is a star schema. So named because the data is organized into a central fact table surrounded by multiple dimension tables, resembling the shape of a star.

Over the years, the star schema has become the most common data model for analytics warehouses and remains so today. In their Coalesce 2022 presentation, “Babies & Bathwater: Is Kimball still relevant,” Sydney Burns and Josh Devlin lampooned popular star schema alternatives; much to the delight of the onlooking dbt community.

Identify the business domain and critical questions your business users want to understand.
Identify the numerical values and measures that need to be analyzed. These can be additive, semi-additive (such as inventory or account balances), and non-additive (such as unit price) values based on the dimensions and the grain of the facts.
Determine the grain for your fact table. Examples are “one row per customer” or “one row per sale.”
Determine your dimensions, which are typically used to filter, group, and categorize the data in your fact tables.
There are 5 key benefits of using a star schema for your analytics models:
Simplicity: The design is simple and intuitive, easy to understand and work with, which makes it well-suited for data analytics. It has also become the standard model for analytics tools and analytics and business users.
Performance: It’s optimized for fast queries and data storage which is critical when working with large data sets or complex aggregates. Performance gets even better when you have cloud data platforms like Databricks, AWS Redshift, or Snowflake.
Adaptability: The fact tables in a star schema can contain a wide range of numerical data. While the dimension tables usually contain categorical data that can be easily expanded or modified to support new types of analysis.
Normalization: As referenced above, the normalized design avoids data redundancy and eliminates the need for complex joins and logic for NULL or missing data, making querying much more efficient.
Integration: The metadata associated with your star schema is crucial to most data tools, including data catalogs, semantic layers, ETL/ELT, and data modeling tools. Most importantly, it is critical for self-service analytics.
There is a trade-off; as an analytics engineer, you may need to spend a few more thought cycles on ensuring your modeling approach is correct, building pipelines for facts and dimensions. But as I like to say, “Pay me now or pay me 10x later!” Additionally, modern analytics tools promote self-service analytics, scale the business, and leverage the technical metadata of the model to generate efficient queries for complex aggregations, chasm traps, and cohort analysis.
Data modeling best practices: bringing people, process, and technology together
Throughout this post, you read about putting your business users first, thoughtfully selecting your optimizations, and the value of quality data modeling. Building better analytics data models will provide faster time to insights, scale yourself and your business users, enable self-service analytics, and keep your business users happy. But it will also differentiate you from the pack and potentially increase your salary.
So, get started with the ThoughtSpot free trial, build your dimensional models, and see how easy self-service analytics can be. You can also learn more about what makes an analytics engineer stand out in data and analytics trends for 2024.


