

As a BI industry professional, one of the things that intrigues me is the fact that even today, with all the BI tools out there, analyses that cut across multiple business areas are difficult to perform.
Consider a company that sells phone calling cards. Say the marketing department of the company launches promotional campaigns to get their customers to buy more calling cards. Each promotion has a certain impact on sales. How does the company measure the effectiveness of the various campaigns? Did the TV commercial campaign generate more sales than the e-mail one? Where should the next chunk of marketing spend go to maximize the effectiveness of campaigns? How does one do this in near real-time so that campaigns can be adjusted very quickly?
Oh, by the way, we are talking of 10s of millions of customers and 10s of Terabytes of data.
Such analyses are very typical in many verticals and are surprisingly difficult to do with BI tools out there without involving a lot of custom code individually tailored for specific scenarios, specialized experts of those business intelligence tools, or using additional domain-specific applications on top of the tools. After reading this post, you will understand the challenges and be in a better position to think about providing such capabilities to your users.
So why is this so difficult to do? The crux of the problem is the age-old chasm trap relational data modeling construct. Although you may not have heard of it, it is extremely common and often a challenge for BI projects.
Chasm Trap
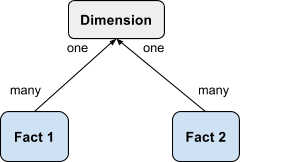
A chasm trap is when two many-to-one relationships converge on the one side and we need to compute aggregations of measures that exist on both the many sides. In dimensional modeling, this manifests when two Fact tables share a common Dimension table and an analysis involves measures from both Fact tables. See the example below that illustrates a chasm trap.
Star Schemas
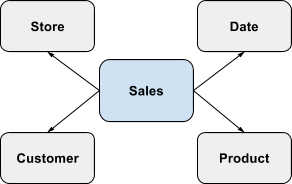
Star schemas are a typical dimensional modeling construct. A star schema captures a particular business process data as numeric measures within a Fact table that are qualified by attributes in Dimension tables. Consider the following star schema involving the Sales Fact qualified by the Product, Customer, Store and Date dimensions. A row in the Sales Fact captures measures about sales transactions for a particular product, sold to a particular customer, at a particular store, during a particular date period.
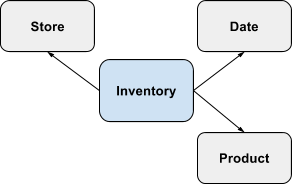
Consider another schema shown below involving the Inventory Fact qualified by the Store, Product and Date dimensions. A row in the Inventory Fact captures measures about stock of a particular product at a particular store during a particular date period.
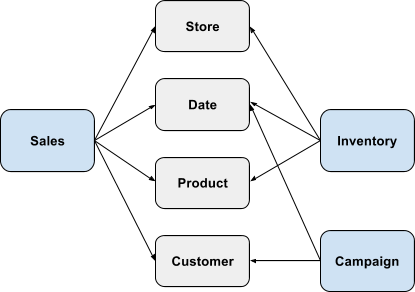
The advantages of Star schemas for analytic queries are well understood. The chasm trap challenge comes when analyzing multiple Fact tables. See the schema below which combines the Sales and Inventory Facts.
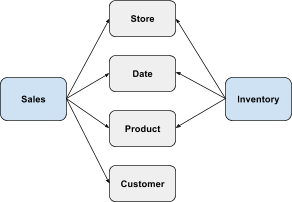
Say the user wants to answer the following question - “What is the monthly sales amount and inventory order amount by product?”. A naive SQL query directly joining these tables would result in the inventory order amount getting overcounted. The right way to compute this is to first aggregate sales amount by product and month (across all stores and customers), aggregate inventory order amount by product and month (across all stores), and then join the two results to produce the answer. Note that the join of the two results may have to be an outer join because there may be some products that were stocked at a store but never sold which the user may want to see. Several departmental BI tools do not compute such things correctly and produce overcounted results.
Chained and Nested Chasm Traps
Now consider an extension of the above schema that includes Campaign data. A campaign involves an interaction with a customer through a medium such as e-mail, print ad etc. to promote products. Each campaign runs for certain period of time.
Say the user wants to answer the following question - “What are the 3 most effective campaigns measured by impact on sales?”. In addition to the chasm trap scenario described earlier, we have another complexity here related to “attribution”. We need to determine which sales can be attributed to which campaigns when there could be multiple campaigns touching a customer at different times with that customer making different purchases. ThoughtSpot allows for specification of attribution to be able to compute such results accurately.
The complexity increases as we add more such Facts through dimension hierarchies and want to answer questions that span them. Consider the extension to the above schema where geographic and demographic information is brought in. Each store is associated with a particular geography and demographic information is associated with each geography.
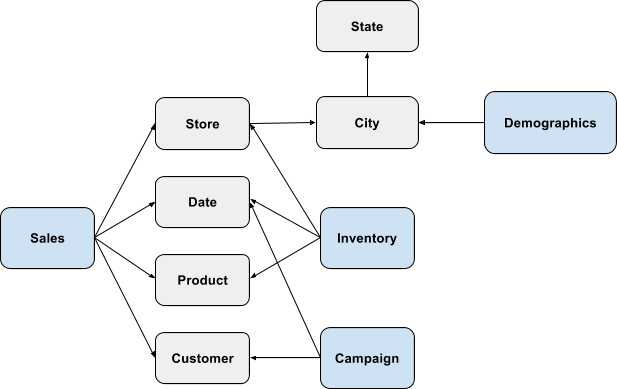
The user may want to answer questions such as - “Which products are selling well with customers in the 20-30 age group?” or “In which states are the TV commercial campaigns most effective in?” or “What is the inventory turnover ratio over the last 6 months?”. <br>Such schemas are referred to as “chained chasm traps” and “nested chasm traps”. A modern BI tool needs to be able to let business users get accurate answers to such questions without the need for special modeling, ETL changes, precomputed aggregated, cubes or materialized views.
Aggregations
Aggregation types add to the complexity of chasm trap queries. When we aggregate each side of the chasm trap query, join the results and then aggregate to get the final answer, non-additive aggregations such as Average, Median, Variance, Standard Deviation, Unique Count do not work the same way as additive aggregations such as Sum. In these scenarios both sub-queries compute sums, counts, sums of squares, sets etc. and the final query uses that to compute the correct aggregated result.
Filters and Formulae
Additional complexity comes when there are filters with determining when and how filters get pushed down versus being applied at the final level. Formulas involving multiple aggregated measures from Fact tables on either side of a chasm trap require computation of the individual constituent aggregations separately and assembly in the final query.
Fan Trap
A concept somewhat related to chasm trap is fan trap. A fan trap occurs when there is a one-many-many relationship among three tables and there are measures on both the many side tables. For example, the schema below shows a fan trap where a customer has many orders and each order has many order details. Both the Order table and the Order Details table have measures in them.
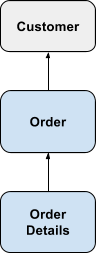
This is again a scenario where there is a potential for double counting if the query generation is not smart to break up the queries into sub-queries involving 2 pairs of tables and joining the two query results in a final query.
In classic dimensional modeling Dimension tables are not supposed to contain measures. However, many real-life schemas violate this and measures are present in Dimension tables. When this happens, double counting can result. This is what we call an “implicit chasm trap” where the measure from the Dimension table can be logically thought of as belonging to a separate Fact table.
Scale
And there is one more thing - SCALE. When a chasm trap spans Fact tables with billions of rows in each, with common dimension tables containing 10s of millions of rows, performant query generation is a challenge.
Optimally, all of the query complexities described above would be handled automatically with no need for special modeling or pre-processing; and it would work at terabyte scale. Most established enterprise BI products today do not handle such complexity or scale without resorting to use-case specific modeling, ETL, pre-computed tables, custom SQL or admin-authored custom reports.
Revisit the analyses you do today. Study your schemas. See if you see similar patterns and ask yourself if you do the kinds of cross-business area analyses we have been talking about, and how you handle them. Solving for these issues as simply and automatically as possible will pay dividends, and significantly increase the success and flexibility of your BI initiative.


