In April 2024, Citigroup credited a customer's account with $81 trillion instead of $280, because staff failed to delete pre-populated zeros in a backup screen. A third employee caught the error 90 minutes after it was posted, and the bank reversed the entry before funds moved. The figure was caught because it was absurd on its face, but a wrong figure that looks reasonable often goes unnoticed.
A plausible figure sails through. It lands on a dashboard, a leader reads it, and a decision follows before anyone asks where it came from. The cost of a data error grows the further it travels. Fixing it at entry costs a baseline amount,roughly 10 times more once it propagates through systems, and 100 times more once it reaches the decision itself, per Dataversity's 1x10x100 rule. By the time a wrong figure shapes a decision, the money is already spent.
Data lineage tracking catches the figures that look fine but are not. It records the full path a figure travels, from its original system, through every transformation, to the final dashboard. That record answers two key questions before a decision is made: where did this come from, and can I trust it?
This article explains data lineage tracking, walks through concrete examples, and connects that technical record to the confidence leaders need before committing to a figure.
What Is Data Lineage Tracking?
Data lineage tracking records how data moves through an organization, from origin through each transformation to end-use. It documents data movement, transformations, and dependencies at every step. It also keeps that map current as pipelines change, allowing anyone to trace a figure back to its source. Visibility into a figure's history forms the foundation of data governance, enabling leaders to confirm accuracy rather than rely on hope.
Lineage captures paths at three levels of detail, each answering a distinct question. Table-level lineage shows how datasets connect, column-level lineage shows how fields are derived, and cross-system lineage traces the journey through databases, warehouses, and BI tools. Modern tracking is automated and updates as pipelines change, preventing the map from drifting out of date when engineers edit jobs.
Three related terms are often confused. Data lineage records the end-to-end flow of data as it happens. Data mapping defines static or intended relationships between fields. Data lineage analysis evaluates the impact and health of flows through downstream systems. These distinctions become crucial when tracing real figures.
How Data Lineage Shows Where a Figure Came From
Every figure on a dashboard has a history. When a leader asks where a figure came from, lineage traces it backward through systems and transformations to the original source, showing what was calculated, joined, or filtered along the way. This answers where the data originated and what happened to it before reaching the user.
For an executive dashboard figure, the path might run from a CRM transaction, through warehouse transformations, to the BI tool. Seeing the full path allows leaders to evaluate whether the figure rests on sound sources and logic, or if an upstream filter quietly removed necessary data.
Lineage also resolves metric discrepancies. When two dashboards show different figures for the same metric, the cause is often an inconsistent definition applied in one place and missed in another. Lineage highlights this mismatch quickly, ending disputes over which number is correct. Tracing origin is one side of the value; knowing what breaks when upstream data changes is the other.
How Data Lineage Tells You Whether to Trust a Figure
Trust in a figure depends on knowing that nothing upstream quietly changed it. Column-level lineage surfaces which metrics and reports are affected when a source field is modified, so a broken definition gets caught before it reaches a decision. This is the difference between finding out a figure was wrong after acting on it and confirming it was sound beforehand.
Tracing a metric back to its source provides four verification points: the original data source, transformation logic, freshness timestamp, and applied filters or conversions. Together, these elements turn an unverified claim into an auditable figure with a clear, traceable path.
In regulated settings, this trail supports compliance and auditing by documenting data origin and handling. A governed semantic layer carries lineage alongside definitions, ensuring consistent, trusted logic across all queries. Following a concrete example shows how this works in practice.
A Data Lineage Example of a Sales Figure
Consider a revenue figure a CFO is about to present to the board. Lineage tracks its path in three main steps: the original sales transactions recorded in the CRM, a warehouse job that aggregates transactions, converts currency, and removes test records, and the BI tool that renders the final figure on the board dashboard.
Visibility at each step changes what happens when numbers look off. If revenue diverges from expectations, lineage reveals whether the cause lies in source data, transformations, or final calculations, reducing hours of investigation to minutes. While a single figure illustrates the mechanics, changing a definition demonstrates why lineage matters across an entire reporting layer.
A Data Lineage Example of a Changed Definition
Consider a team that redefines "active customer" upstream by shortening the qualifying window from 90 days to 30 days. A single definition change can affect dozens of downstream reports. For instance, a marketing dashboard might show an active customer count drop from 10,000 to 4,000 overnight without explanation, skewing churn models and revenue projections before anyone links the drop to the new definition.
Without lineage, discrepancies surface only when someone notices conflicting dashboards, after incorrect figures have reached decision-makers. Lineage tracking highlights every affected metric, model, and report as soon as definitions shift, alerting owners before leaders act on changed numbers. Data lineage analysis maps change impact before errors cause poor decisions, making lineage essential for confident decision-making.
Why Lineage Matters More in an AI-Driven Analytics Stack
As AI agents query data directly and generate answers, recording answer origins makes outputs usable. An agent that traces outputs back to sources turns plausible responses into verifiable ones, while an untraceable agent leaves leaders with no way to check answers.
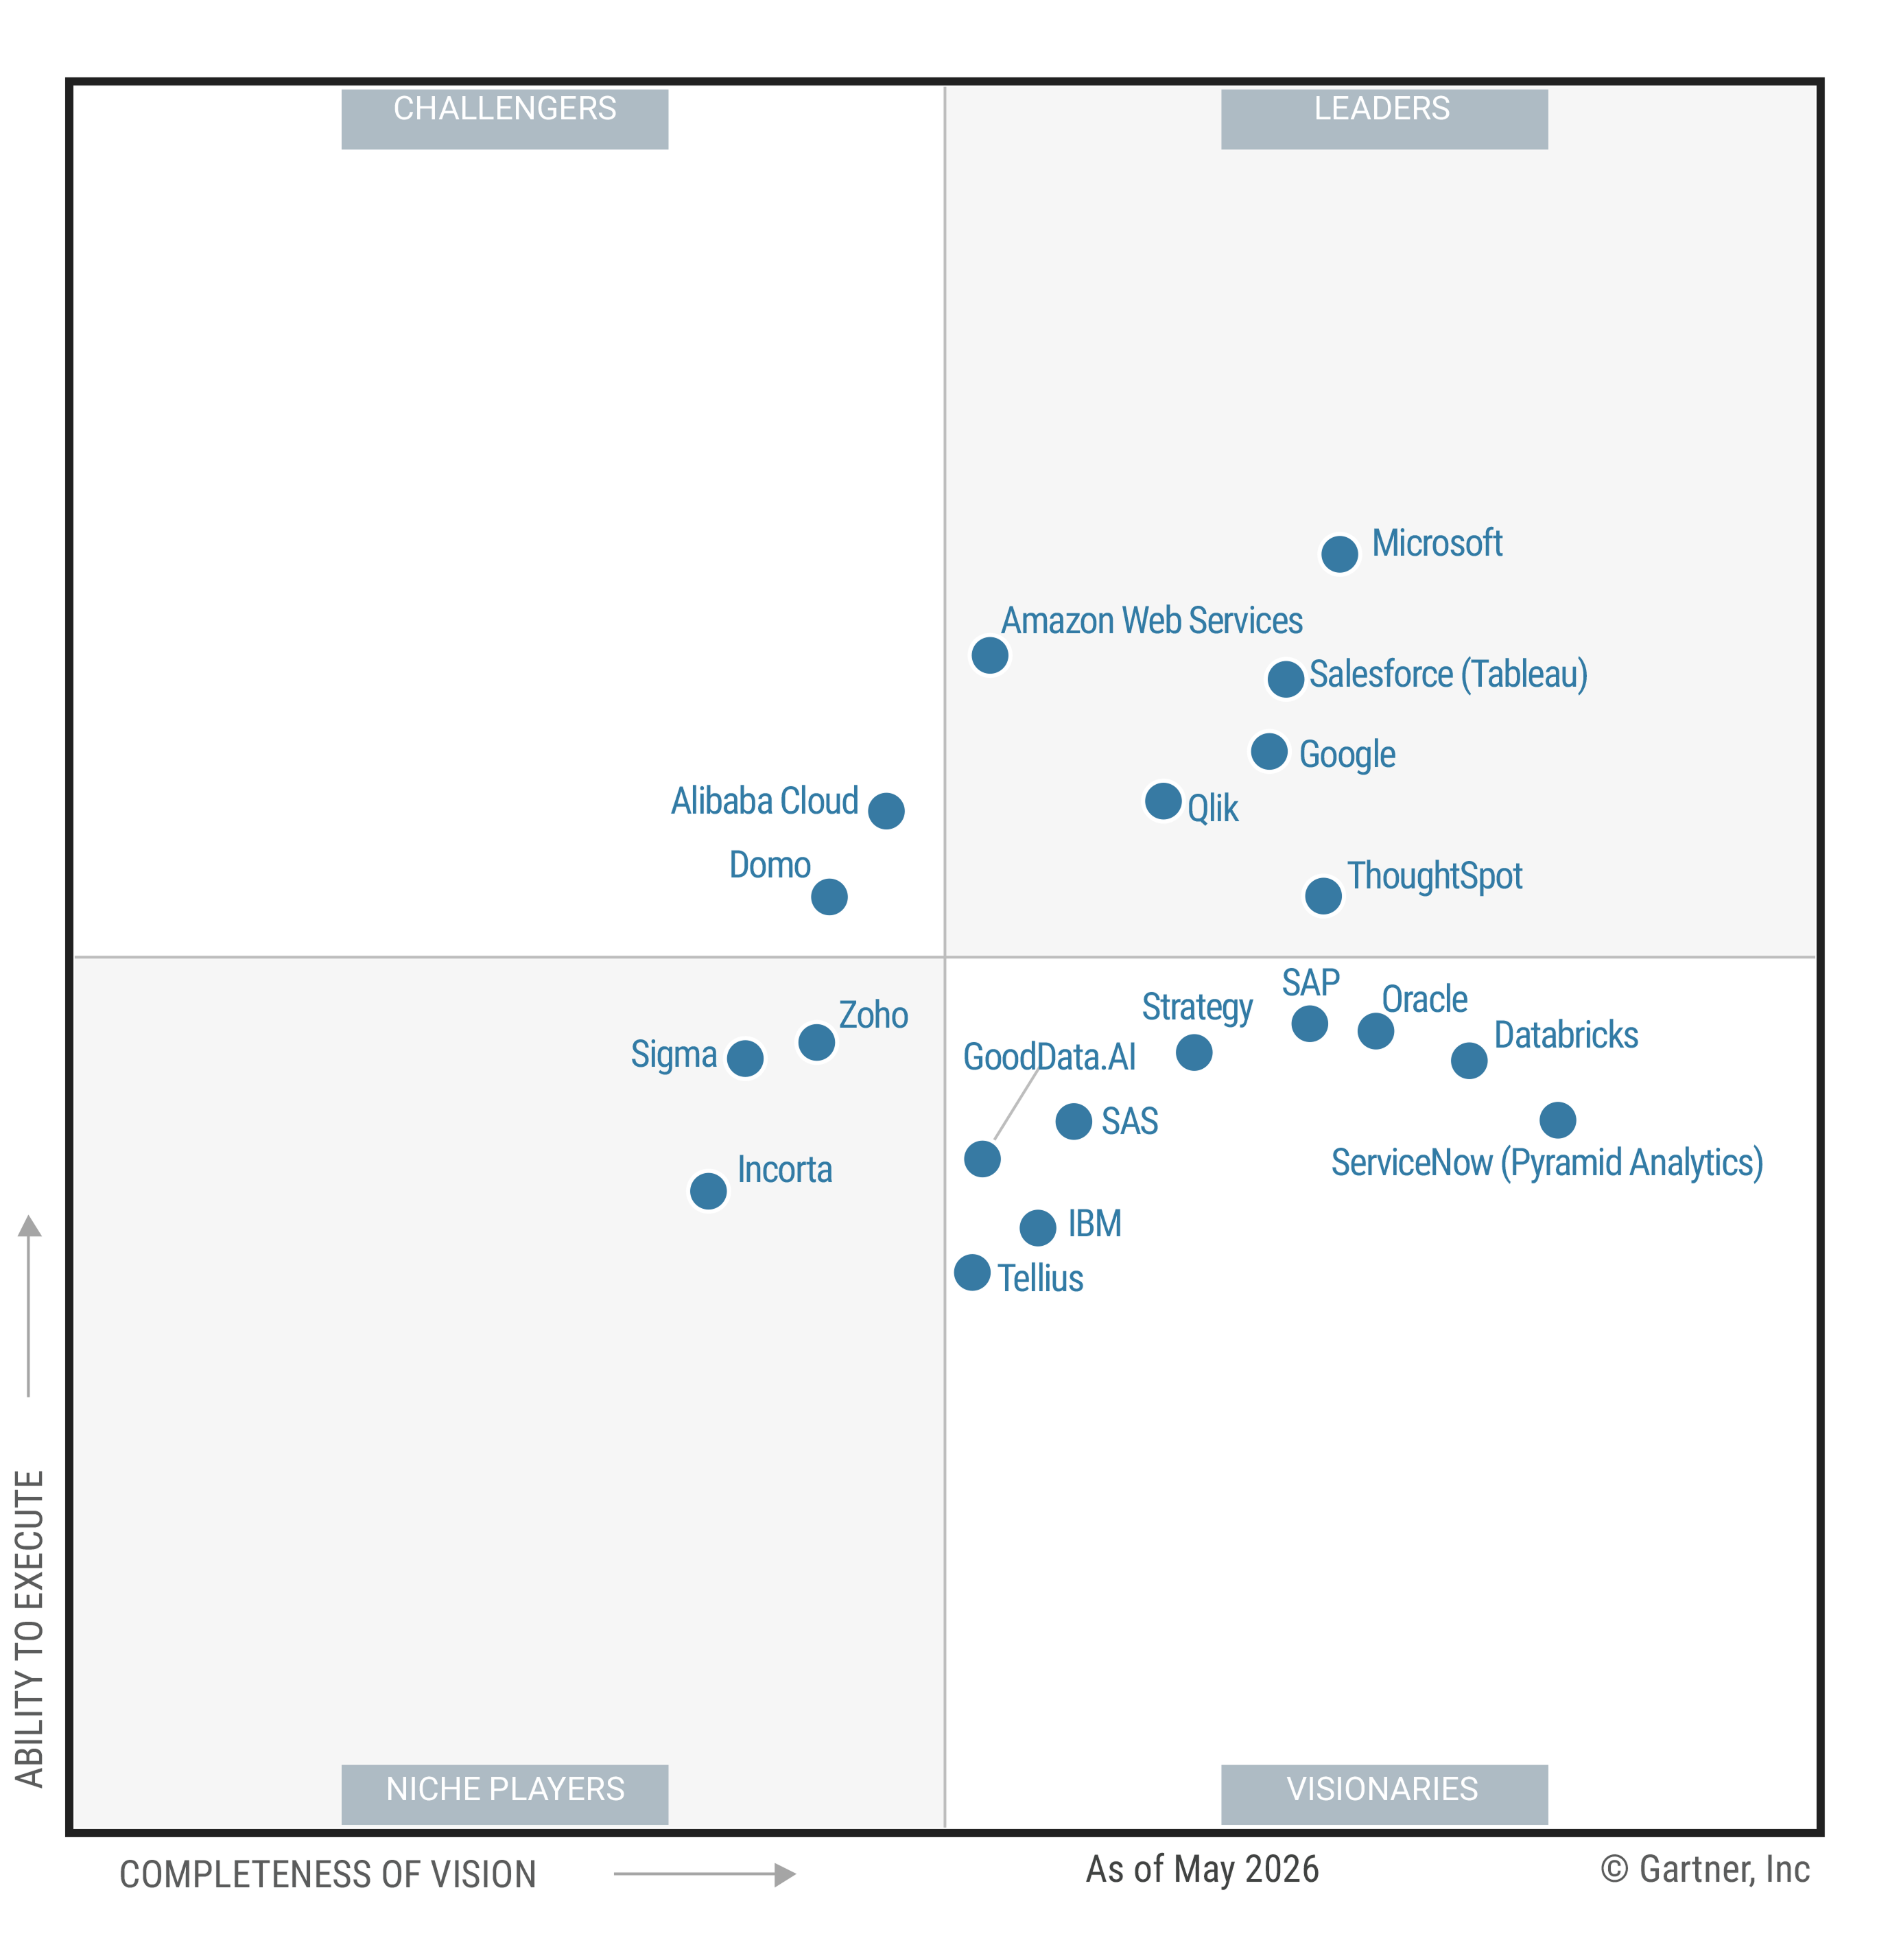
When AI agents interpret questions and generate answers, lineage makes each response auditable, allowing leaders to confirm accuracy beyond the agent's confidence score. A governed semantic layer grounds answers in defined metrics and carries underlying lineage, maintaining trust as usage grows. ThoughtSpot'sagentic semantic layer connects each generated answer to its underlying metric definition.
Without a traceable path, risks increase because an AI answer based on incorrect fields looks identical to a correct one. As more users and agents act on figures without seeing underlying pipelines, the stakes for untraceable answers rise. Reliable figures require both underlying records and a platform that surfaces them in active workflows.
How ThoughtSpot Builds Trust Into Every Figure
Tracing origins, inspecting transformation logic, and assessing change impacts deliver value when integrated directly into decision-making workflows. ThoughtSpot bridges this gap by anchoring every answer in a governed semantic layer that carries definitions and lineage together, giving business users traceable, defensible data from plain-language queries.
This governed layer applies consistent definitions and lineage across all queries, maintaining trusted logic across dashboards and agents.Spotter, ThoughtSpot's AI Analyst, grounds responses in this layer, keeping natural-language results traceable and improving data literacy by allowing users to verify figures independently. Traceable figures give leaders the confidence to act, turning analytics from debate into action.
See how governed analytics makes every figure traceable
Frequently Asked Questions About Data Lineage Tracking
What is the main difference between data lineage and data provenance?
Data lineage records the complete workflow path, transformations, and system dependencies of data as it travels from source to destination. Data provenance focuses on the ultimate origin, ownership, and authenticity of the data point itself.
How does data lineage support compliance and audits?
Lineage creates an auditable trail documenting how sensitive data is processed, transformed, and shared through systems, which makes it straightforward to satisfy regulatory requirements like GDPR, HIPAA, or BCBS 239.
Can data lineage tracking be fully automated?
Yes. Modern data lineage tools extract metadata automatically from database logs, ETL jobs, transformation code, and BI tools, updating lineage maps dynamically as pipeline code changes.