- Strategic dashboards help leaders track longer-term outcomes and shared business priorities.
- Operational dashboards help teams monitor current activity and respond to conditions that need attention.
- Analytical dashboards help people investigate trends, drivers, comparisons, and exceptions.
- Tactical dashboards help teams manage plans, resources, milestones, and shorter-cycle performance.
- Choose a dashboard by its audience, decision, data freshness, and required depth, not by its charts.
The four main types of dashboards in this practical framework are strategic, operational, analytical, and tactical. Each supports a different decision horizon, audience, and level of investigation, and your organization may use all four.
The labels give you a useful starting point, not a universal industry standard. Your best choice depends on what someone needs to decide, how quickly the data changes, and what action follows.
What Are the Main Types of Dashboards?
A dashboard presents selected metrics and visualizations so you can monitor and analyze a defined topic. The UK Office for National Statistics offers a dashboard overview that defines a dashboard as a tool used to monitor, analyze, and display data.
For this guide, the four dashboard types form a practical planning framework.
| Dashboard type | Main purpose | Common audience | Typical time horizon | Example questions |
|---|---|---|---|---|
| Strategic | Track direction and shared outcomes | Executives and senior leaders | Longer term | Are we progressing toward annual goals? |
| Operational | Monitor work in motion | Frontline teams and managers | Current or near term | What needs attention right now? |
| Analytical | Investigate trends and causes | Analysts and business teams | Historical or flexible | What changed, and what contributed to it? |
| Tactical | Manage a team plan | Department and team leaders | Shorter cycle | Are resources and activities on plan? |
These categories can overlap because the same metric may support several decisions. Revenue, for example, could appear as an annual strategic outcome, a weekly tactical target, or a subject for analytical exploration.
The purpose shapes the view. For related product information, learn more about interactive dashboard capabilities.
Strategic dashboards: Track long-term business direction
Strategic dashboards help leaders maintain a shared view of longer-horizon priorities. They often present a focused set of outcomes and KPIs, such as revenue, retention, operating margin, or progress toward annual goals.
The reporting window should match the decision. An annual planning dashboard may emphasize quarterly movement, while a fast-changing business model may require more frequent reviews.
Keep this view focused on direction and material change. Too much operational detail can hide the few signals that leadership needs to discuss, challenge, or use in resource decisions.
A strategic dashboard might answer questions such as:
Are we progressing toward our annual revenue plan?
Which business unit is contributing most to margin change?
Is customer retention moving in the expected direction?
Which strategic objective needs leadership attention?
As a practical design choice, give each strategic metric a shared definition and accountable owner. For related product information, learn more about enterprise business intelligence.
Do not use a strategic dashboard to manage daily work. If someone must respond to a queue, exception, or service issue today, an operational view will usually fit better.
Operational dashboards: Monitor the work happening now
Operational dashboards help frontline teams and managers monitor active processes. They may refresh frequently or use near-real-time data when the work requires a quick response.
Common examples include open support tickets, inventory exceptions, fulfillment timing, service-level performance, and system health. The useful signal is usually specific enough to prompt an immediate response.
The UK Government Analysis Function says government dashboard guidance treats interaction as a major dashboard benefit. It notes that interaction can let users view data in different combinations, while the right refresh rate still depends on your process.
Give each operational metric enough context for the intended response. A ticket count may need a threshold, direction, priority, and the person responsible for acting.
Build the view around a simple response loop:
Observe the signal. Show the current state and meaningful threshold.
Identify the exception. Make the item requiring attention easy to locate.
Assign the response. Clarify which role or team owns the next action.
Check the result. Show whether the condition returned to an acceptable range.
Alerts can help when people should not watch a screen continuously. For related product information, learn more about proactive KPI monitoring.
An operational dashboard should stay close to the process it monitors. If the main question is whether a department is meeting a monthly plan, you probably need a tactical dashboard instead.
Analytical dashboards: Explore trends, drivers, and exceptions
Analytical dashboards help you investigate patterns, comparisons, and possible contributing factors. They support questions that rarely end with a single metric or chart.
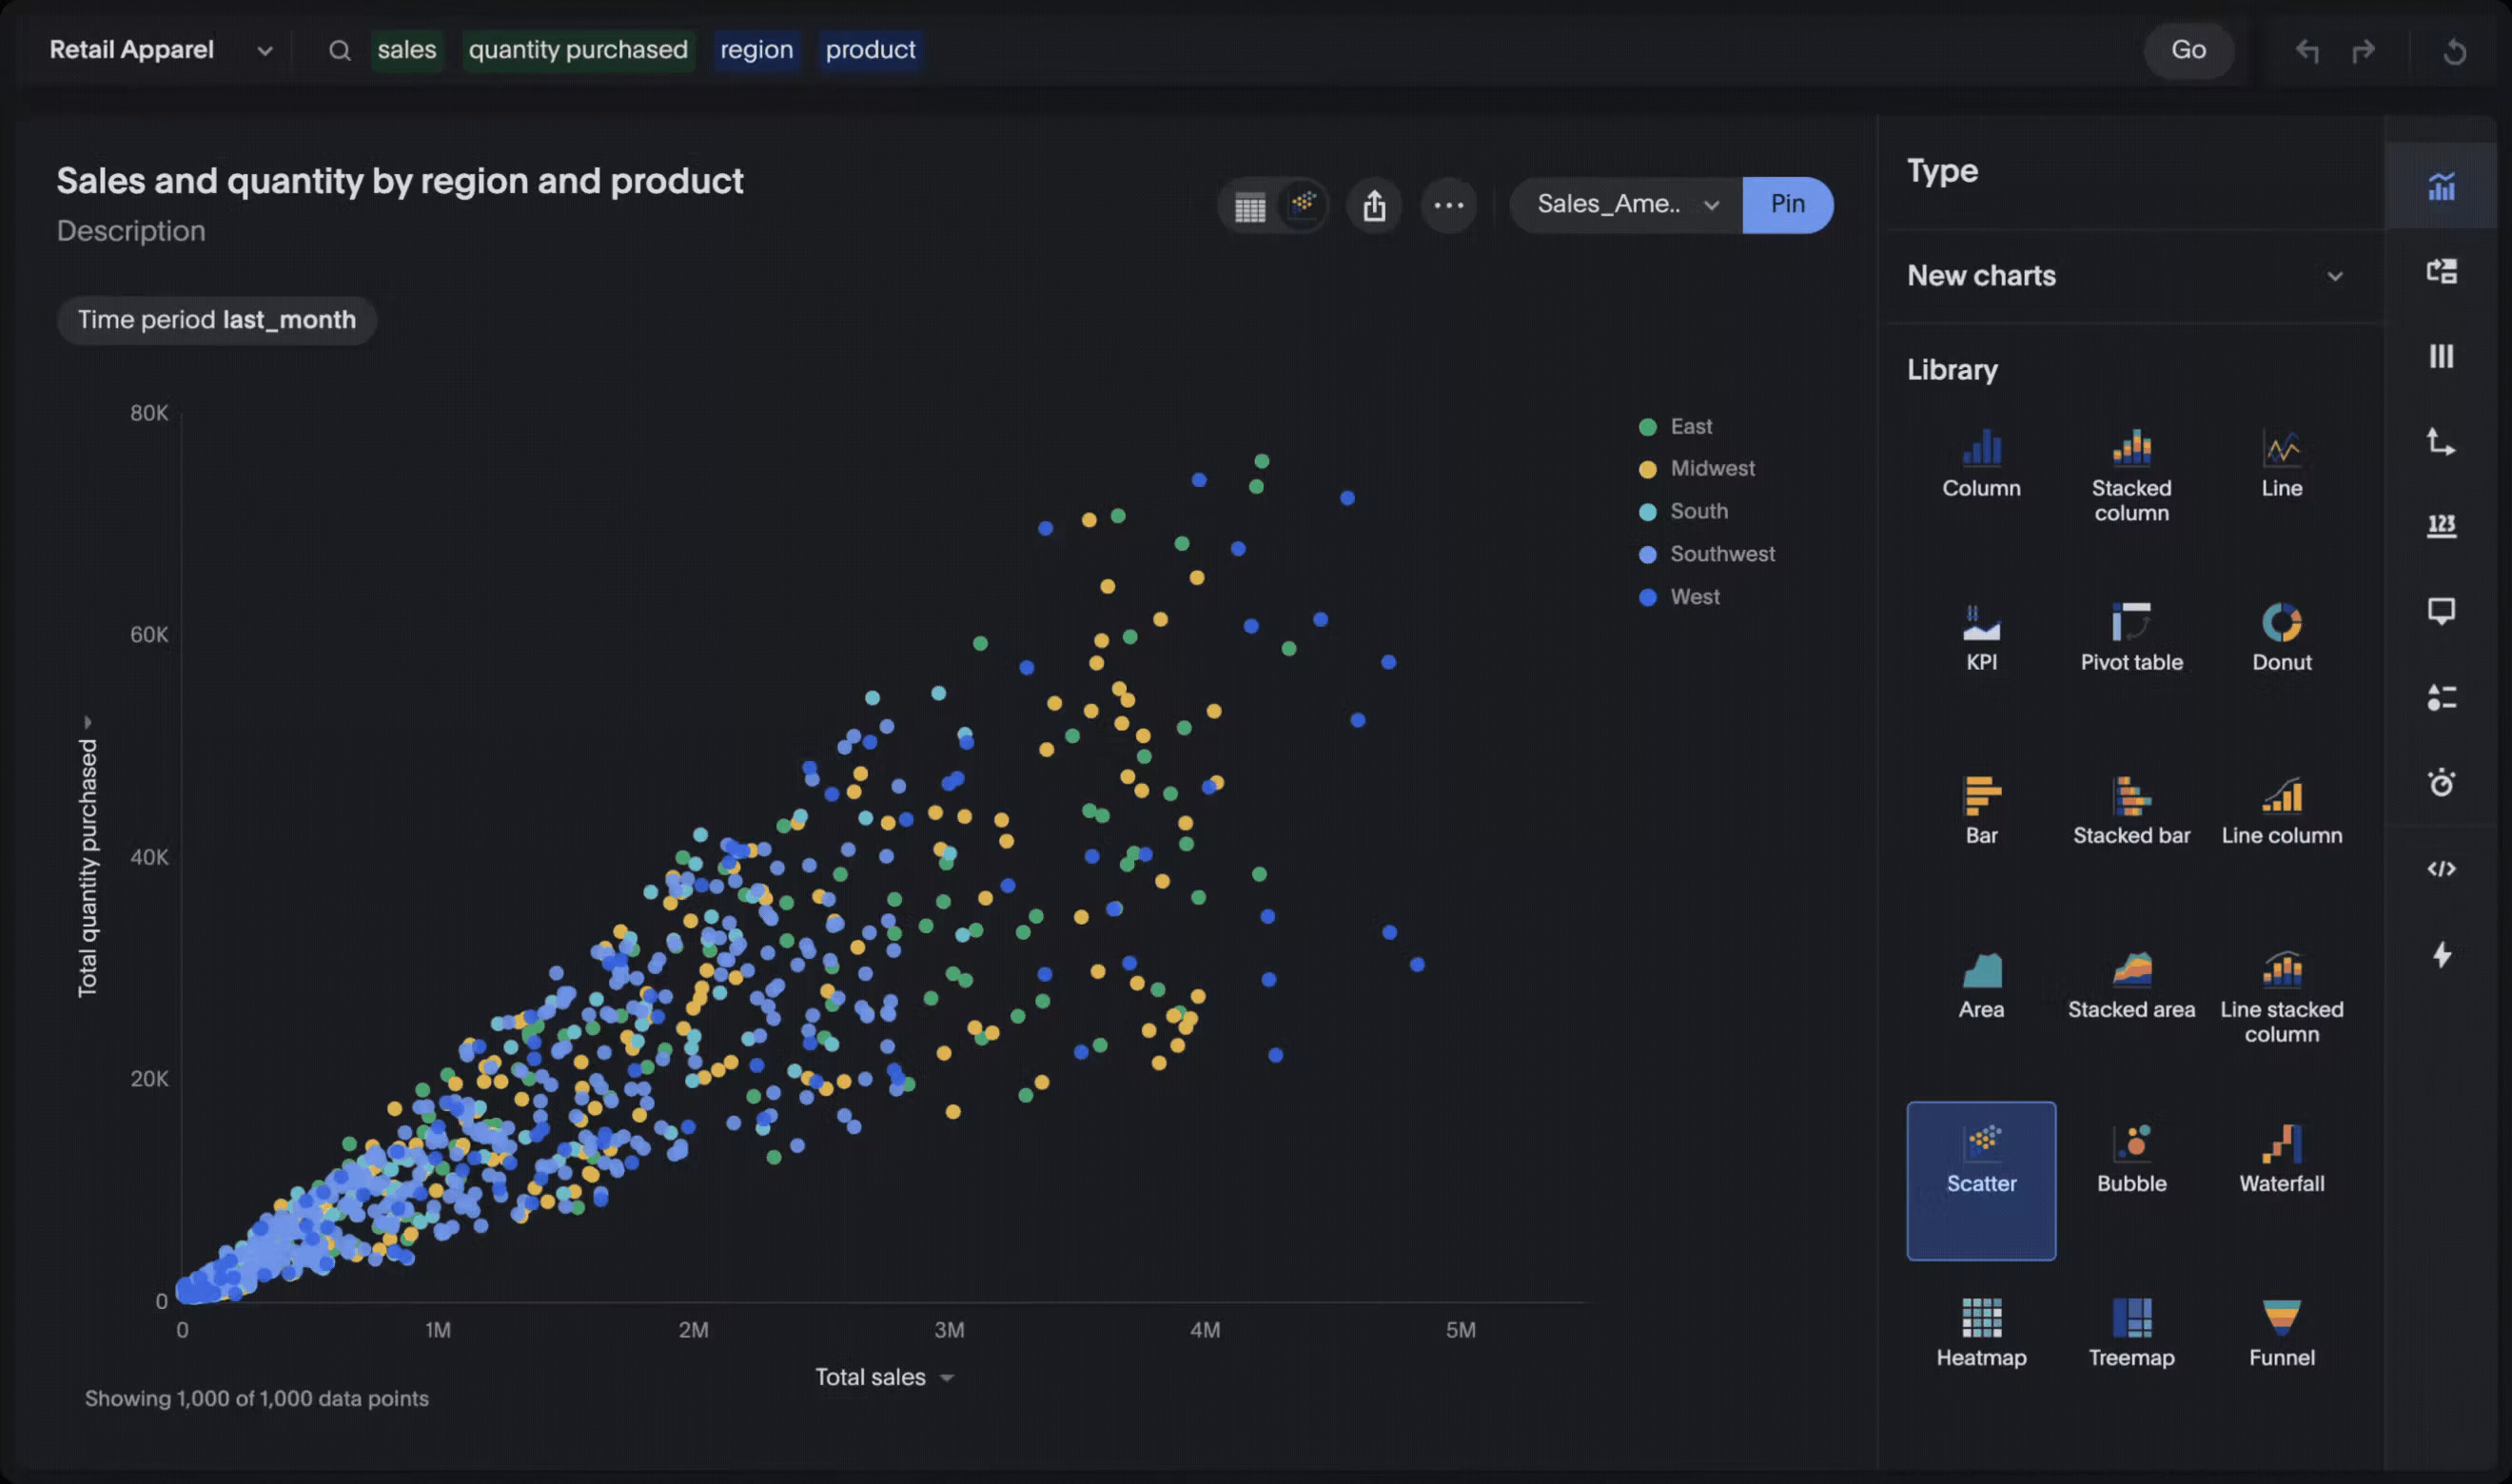
You might analyze churn by customer cohort, marketing performance by channel, or procurement spend by supplier. Filters, segmentation, and drill-down can help you compare groups and inspect the detail behind an unusual result.
Start with the user and the task they need to complete. Then define the audience and decision before choosing the dashboard's content.
Start with a clear business question, then add enough context to support investigation. A chart should open a line of inquiry rather than close it.
For example, a churn dashboard might begin with the overall rate. From there, you may need to compare tenure, product, region, contract type, or support history before you can form a useful next question.
Useful analytical interactions can include:
Filtering a view by period, segment, or region.
Comparing categories with a consistent metric definition.
Drilling into underlying records when detail is relevant.
Switching between summary and granular views.
Asking a follow-up question about a visible change.
When you are ready to explore product options, learn more about exploratory analytics workflows. Keep the dashboard's purpose and audience at the center of that evaluation.
Avoid adding every available filter simply because you can. Each control should help the intended audience answer a likely question without turning the dashboard into a maze.
Tactical dashboards: Keep teams on plan
Tactical dashboards help a department or team manage shorter-cycle plans, resources, and performance. They connect broader objectives with the activities and adjustments that a team can control.
Examples include campaign pacing, sales territory performance, project milestones, staffing allocation, and budget versus actuals. These views often support weekly or monthly reviews, though the cadence should match the plan.
The distinction from an operational dashboard comes down to intent. Operational dashboards watch a process in motion, while tactical dashboards help a team compare progress with a plan and decide what to adjust.
A tactical marketing dashboard, for example, might show spend, pipeline, and campaign pacing against a quarterly plan. An operational marketing view might focus on a failed data feed, an active budget exception, or leads awaiting assignment.
Choose the layout and review cadence around the team's plan, available actions, and decision horizon. Keep targets, current performance, and adjustable levers easy to distinguish during each regular team review.
Good tactical views connect targets, current performance, and the levers available to the team. If managers cannot tell what they can adjust, the dashboard may be reporting activity without supporting the planning conversation.
Use consistent business definitions when several teams review related measures. For related product information, learn more about governed data models.
How to Choose the Right Dashboard Type
Start with the decision, not the visualization. Carnegie Mellon University's data visualization guidance distinguishes operational dashboards for real-time monitoring from exploratory dashboards for exploring data and identifying trends.
Use the matrix below to turn those questions into a practical dashboard brief. It is a planning tool, not a validated scoring model.
| Selection factor | Strategic | Operational | Analytical | Tactical |
|---|---|---|---|---|
| Decision horizon | Longer-term direction | Current process or condition | Flexible investigation | Shorter-cycle plan |
| Primary audience | Leaders and executives | Frontline teams and managers | Analysts and business teams | Team and department leaders |
| Data freshness | Matches strategic review rhythm | Frequent enough for response | Matches the analysis question | Matches planning cadence |
| Level of depth | Focused summary | Actionable exceptions | Segments and underlying detail | Plan, variance, and controllable drivers |
| Typical action | Reprioritize or allocate | Respond or escalate | Investigate or recommend | Adjust resources or activities |
Use the table as a starting point rather than a fixed assignment. If a dashboard serves two decisions, separate the views or make the change in purpose obvious.
Choose the lightest level of detail that supports the decision. Add deeper exploration only when the audience needs it.
One organization may use every type at once. A board can review a strategic dashboard, operations can monitor daily exceptions, analysts can investigate drivers, and department leaders can manage tactical plans.
Before you build, write a short design brief that answers six questions:
Who will use it? Name the audience and their level of data familiarity.
What decision will it support? State the decision in one plain sentence.
Which definitions apply? Document the metrics, filters, and business rules.
How fresh must the data be? Match refresh timing to the decision's urgency.
What happens after a signal? Name the action, owner, or escalation path.
What should users investigate next? Define useful filters, comparisons, or drill paths.
If you cannot answer those questions, clarify the brief before selecting charts. Define the audience and intended action so the finished view has a clear purpose.
Avoid asking one dashboard to serve every audience. Instead, share metric definitions across purpose-built views that match each audience's decisions and desired depth.
Review each view when its metrics, workflow, or audience needs change. This keeps the recommendation practical without forcing every use case into one dashboard.
Make Every Dashboard a Starting Point for Better Questions
Choosing among the four types of dashboards helps you define the view. The bigger opportunity is giving people a path from a visible signal to the detail, question, or action that follows.
Match the depth of exploration to the decision and the people making it. A focused monitoring view may need less detail, while an investigative view may benefit from filters, comparisons, or drill-down.
Add depth where the audience needs to investigate, and keep the experience focused where monitoring or alignment is the main job. Treat every interaction as a deliberate design choice.
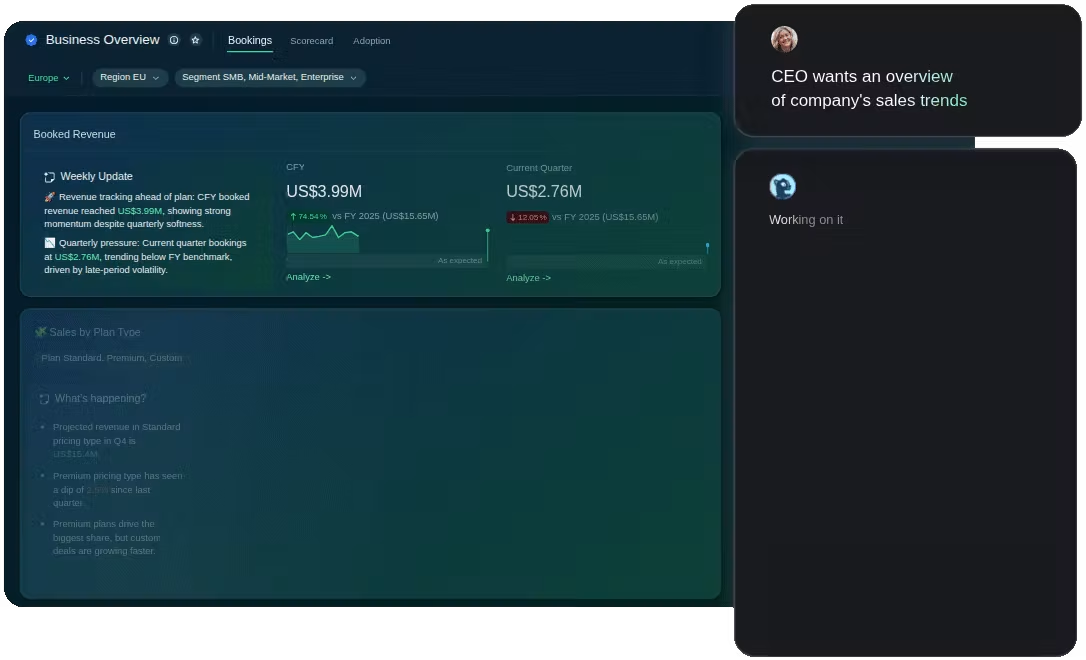
A useful dashboard gives you a clear first view and a sensible next step. To continue exploring, visit ThoughtSpot's page on how to ask follow-up questions of your data.