


Imagine this: You’re an IT leader overseeing a complex web of digital tools and platforms. Every day brings a new set of challenges, from ensuring system uptime to managing application performance, handling security incidents, and providing seamless user support. It's a balancing act, and the stakes are high.
Many IT leaders are adopting advanced technologies. In fact, a Deloitte report found that 68% of IT leaders are investing in AI and machine learning to automate and enhance their operations. These technologies promise to revolutionize IT management, but they also introduce new layers of complexity.
IT dashboards have become essential for optimizing operations. They provide visibility into key IT metrics, enabling you to monitor performance, detect issues, and drive informed decision-making.
Table of content:
An IT dashboard is a visual interface that provides real-time insights into various aspects of your organization's IT infrastructure and operations. It typically displays key performance indicators (KPIs), metrics, and trends related to IT systems, applications, networks, and security. By consolidating data from various sources, an IT dashboard enables you to monitor the health, performance, and security of your IT assets all in one place.
Think of your IT dashboard—or as we call it, Liveboard—as the primary interface for vital IT metrics. It allows you to track and visualize your IT environment, including network status, server health, and application performance.
For instance, consider an IT operations dashboard. It might showcase metrics such as system uptime, incident response times, and security threat levels. These insights help ensure your IT operations run smoothly and efficiently by minimizing downtime and enhancing overall performance.
Real-time monitoring: IT dashboards enable stakeholders to monitor critical IT metrics in real-time. By gaining up-to-the-minute insights, you can proactively solve problems, optimize cloud performance, and help prevent potential issues before they escalate.
Data-driven decision-making: By consolidating data from diverse IT sources into a single interface, IT dashboards facilitate data-driven decision-making. You can analyze trends, identify patterns, and make informed decisions to drive business success.
Security monitoring: IT dashboards provide visibility into security incidents, vulnerabilities, and threat levels. You can detect and respond to security threats promptly, minimizing the risk of data breaches and cyber-attacks.
Efficient resource allocation: You can better allocate IT resources like server capacity, bandwidth, and support personnel, ensuring effective utilization for cost savings and improved operational efficiency.
Compliance and governance: IT dashboards help ensure compliance with regulatory requirements and internal governance policies. By monitoring key metrics related to compliance such as audit trails and access controls, organizations can demonstrate adherence to standards and mitigate compliance risks.
Customized to suit your organization's specific goals, IT dashboards excel at tracking various metrics. Here are some common metrics you might include:
System uptime: Measure the percentage of time IT systems are operational and available for use
Incident response times: Track the speed at which IT incidents are detected, reported, and resolved
Security threat levels: Monitor the severity and frequency of cybersecurity threats and vulnerabilities
Server capacity utilization: Assess the proportion of available server resources being used to support IT operations
Bandwidth usage: Measure the amount of network bandwidth consumed by data transmission activities
Support ticket volumes: Track the number of IT support tickets opened over a specific period
Application performance metrics: Monitor the performance of critical applications, including response times and error rates
Backup and recovery status: Assess the effectiveness and integrity of data backup and recovery processes
Patch management compliance: Ensure adherence to patch-management policies and procedures to address software vulnerabilities
User activity logs: Capture and analyze user activity data to detect anomalies and unauthorized access attempts
Step 1: Define your objectives
Begin by clearly defining the objectives of your IT dashboard. Identify the specific aspects of IT management you want to measure and improve. Identify a mix of KPIs and metrics that align with these objectives:
Operational metrics: Track system uptime, network latency, and application performance to ensure optimal IT operations.
Security metrics: Monitor security-incident rates, vulnerability assessments, and compliance status to mitigate security risks.
Efficiency metrics: Measure resource utilization, response times, and incident resolution rates to enhance operational efficiency.
Step 2: Select the right data sources for your dashboard
Select the appropriate data sources for your IT dashboard, including structured and unstructured data. Modern dashboard tools like ThoughtSpot connect to various data sources such as data warehouses that contain information on network monitoring tools, server logs, security systems, and ticketing systems. This enables seamless integration of diverse data streams, empowering your IT team to quickly connect and analyze live data.
💡Choosing the right data sources can be tough—discover why "Context is Gold" when crafting your IT dashboard.
Step 3: Design and create visualizations
Design the layout and structure of your IT dashboard, focusing on creating data visualizations that effectively communicate key insights. Traditional dashboard tools often demand multiple steps and considerable manual labor to achieve visual appeal and insightfulness. It entails meticulously outlining the layout, determining the placement of charts, and ensuring a prominent display of critical data. Additionally, integrating interactive features like drill-downs can prove time-consuming, often necessitating custom SQL and scripts.
ThoughtSpot Liveboards offer a leading-edge approach to data visualization and analytics, surpassing the constraints of traditional BI tools. They feature intuitive layouts that efficiently convey essential insights. Interactive functionalities such as drill-downs, filtering, and AI-assisted analysis empower users to explore data comprehensively, enhancing the overall experience.
Similar to the sales Liveboard shown below, you can tailor your IT Liveboard to showcase critical metrics and drill down deeper to understand them.
Step 4: Deploy and monitor
Once your dashboard is ready, it's time to roll it out to your team and appropriate stakeholders. Identify key advocates within your organization who can back the adoption of the dashboard. These advocates can lead by example and inspire others to embrace the tool. Introduce gamification elements such as friendly competitions to use the dashboard. Conduct regular training sessions to ensure users understand how to make the most of it.
Post-deployment, it's crucial to keep a close eye on its usage and strive for ongoing enhancement. Establish a consistent monitoring routine, typically on a monthly or quarterly basis. Additionally, maintaining open communication with your advocates is vital to sustain momentum and foster continued adoption.
These deployment and monitoring tactics are applicable to both traditional dashboarding tools and modern solutions like ThoughtSpot’s Liveboards.
Step 5: Continuously improve
Regularly review and update your IT dashboard to ensure it remains aligned with your organization's evolving goals and objectives. Incorporate new data sources, metrics, and visualizations as needed to address emerging challenges and opportunities. By continuously iterating and improving, you can ensure your IT dashboard remains a valuable asset for driving organizational success.
1. Network performance dashboard
The network performance dashboard provides real-time insights into the performance of a company's network infrastructure. It might include metrics like bandwidth usage, latency, packet loss, and device health status. Visualizations include line graphs showing trends over time and heat maps indicating areas of high network activity.
2. Security incident dashboard
Security is a top concern for any IT department, so a dashboard focused on security incidents is crucial. It displays information about recent security breaches, threat alerts, malware detection rates, and system vulnerabilities. Bar charts show the number of incidents by severity level, while pie charts break down the types of security threats detected.
3. Service desk dashboard
For tracking IT support tickets and service requests, a service desk dashboard is essential. It features metrics such as ticket volume, resolution times, customer satisfaction ratings, and agent workload. Tables list open tickets categorized by priority, along with their current status and assignee.
4. Application performance dashboard
Many businesses rely on custom or third-party applications to run their operations smoothly. An application performance dashboard monitors the health and performance of these applications, including response times, error rates, and resource utilization. Gauges indicate the availability of key applications and line charts show how performance metrics have changed over time.
5. Infrastructure capacity planning dashboard
To ensure that IT infrastructure can support current and future demands, capacity planning dashboards are essential. They include data on server CPU and memory usage, storage capacity, and virtual machine allocation. Trend lines predict when resources will reach capacity based on current usage patterns, helping IT teams proactively scale infrastructure as needed.
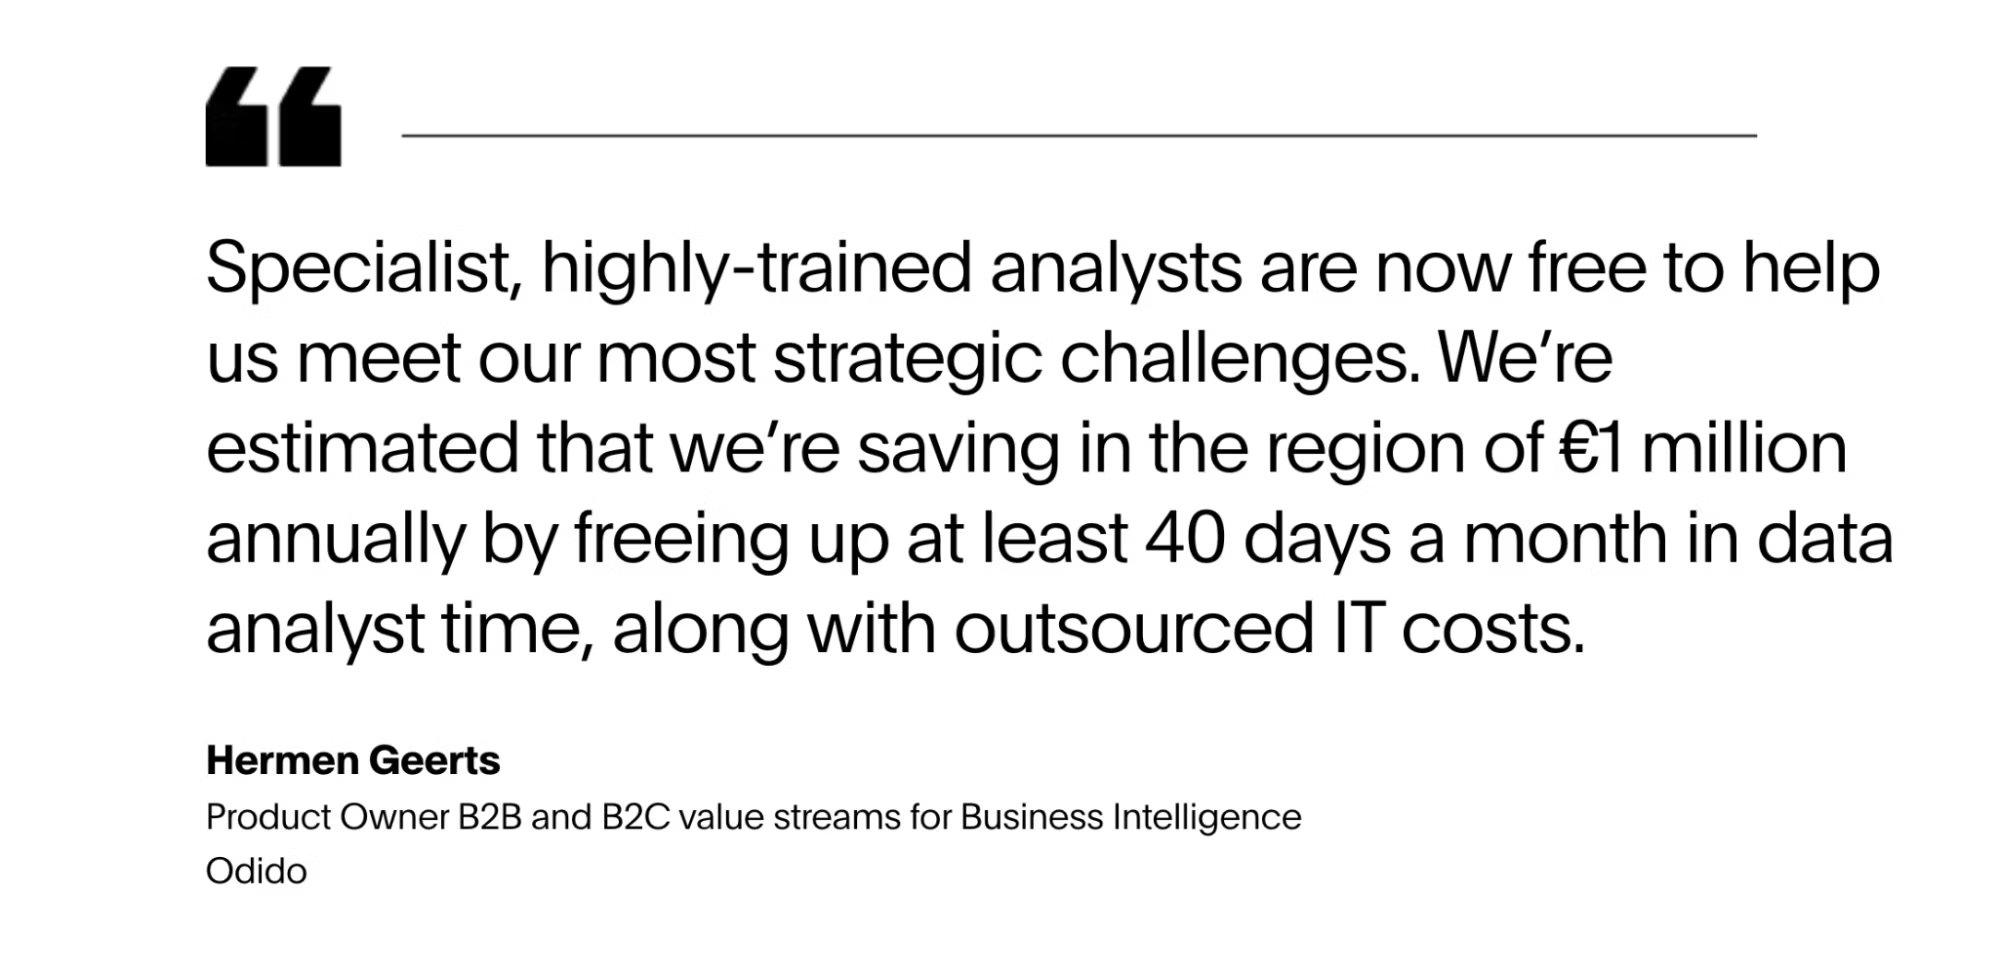
Odido
Odido, a major mobile network operator in the Netherlands, underwent a significant IT transformation. Previously, Odido's IT and data teams faced significant delays and high costs, taking days or even weeks to analyze customer data and process requests. This inefficiency led to increased IT management costs and slower decision-making.
By embracing a dashboard culture, Odido streamlined its data analytics processes. Leveraging ThoughtSpot for dashboard creation, they dramatically reduced the time needed to access data and build actionable insights to mere minutes. This improvement not only boosted productivity but also resulted in annual cost savings of €1 million.
ThoughtSpot enabled Odido to analyze IT spending across storage, maintenance, and billing, providing accurate reports for each department's consumption. These insights allowed Odido to identify cost optimization opportunities and streamline capacity planning, ensuring operations were both functional and financially sound.
Snowflake
Snowflake helps thousands of organizations mobilize their data in the Data Cloud. With a global workforce, they needed actionable insights to streamline processes. Seeking a solution beyond pre-canned reports, Snowflake turned to a self-service analytics platform to empower data-driven decision-making.
Today, Snowflake leverages ThoughtSpot to integrate real-time ServiceNow data into its internal database. This enables instant visualization and analysis, reducing insight generation time. With ThoughtSpot, Snowflake achieves 99% of IT commit goals and increases time spent on high-value initiatives by 20%.

As businesses face the challenges of IT analytics, it's essential to adopt forward-thinking solutions. ThoughtSpot changes the game with AI-Powered Analytics,. Its intuitive approach allows users to ask questions and instantly receive AI-assisted insights, empowering teams to make data-driven decisions effortlessly.
Don't let outdated analytics tools hold you back. Experience the future with ThoughtSpot–schedule a demo today.


