- Your reports may share a label but show different numbers. Sales BI works best when each metric has a definition, owner, and decision purpose.
- Start with the sales decision. Then choose the data, metric, and view that support it.
- Evaluate the whole path from source data to action. Data quality, governance, drill-down, and workflow matter as much as the dashboard.
- When natural-language analytics uses generative AI, test the experience with representative questions, monitor it during use, and verify material findings before acting.
Your pipeline review gets harder when the CRM, spreadsheet, forecast call, and dashboard tell slightly different stories. Sales BI gives you a governed way to analyze internal sales data so you can make clearer decisions about performance, pipeline, and execution.
In practice, sales business intelligence brings data, shared metrics, dashboards, and analysis into one operating approach. You can ask which deals changed, where opportunities are aging, or how conversion differs by segment. Then you can focus the next review.
What Sales BI Means for Your Team
Sales BI is the use of governed sales operating data, metrics, and analysis to support sales decisions. It can bring together your customer relationship management platform, engagement platform, finance data, and planning process. Those sources need shared definitions and controls.
For a wider foundation, think of BI as the use of organizational data and analysis to support decisions. Sales BI applies that approach to questions about pipeline health, conversion, performance, forecasts, and day-to-day execution.
What might that look like before a weekly review? You could examine which opportunities moved stages, where expected close dates changed, or which forecast assumptions need discussion. The dashboard supplies context, while your team still applies judgment to the decision.
A Working Distinction Among Sales Data Terms
This article uses a practical working distinction among sales BI, sales intelligence, and revenue intelligence. The table below is a guide for this discussion, not a universal taxonomy.
| Term | Working meaning in this article | Typical questions |
|---|---|---|
| Sales BI | Analysis of internal sales-process and performance data for operating decisions | Where is pipeline changing? Which segments have longer stage aging? How does actual performance compare with the current forecast? |
| Sales or market intelligence | Research signals about customers, competitors, markets, and trends | Which accounts fit your market focus? What external changes could affect demand or positioning? |
| Revenue intelligence | A variable term often used for a broader view of revenue processes and signals | How do sales, marketing, customer, and financial signals connect across the revenue process? |
The National Institute of Standards and Technology's market intelligence guidance discusses analyzing customer, competitor, industry, market, and trend information. It frames that analysis as support for decisions. Your organization or a vendor may use these labels differently, so define each term before comparing platforms.
Build Your Sales BI Scorecard Around Decisions
A useful scorecard starts with a decision, not a crowded inventory of metrics. Before adding another chart, ask what choice the viewer needs to make and which follow-up question will come next.
For example, a pipeline review may need to identify stage movement, aging opportunities, changed close dates, and gaps in the data. A territory review may need a different grain, timeframe, and set of comparisons. Together, those questions help you use sales data to examine performance and behavior.
Start With the Decision and Metric Contract
Two reports can use the same metric name and still disagree. One may count opportunity creation dates, while another uses expected close dates. One may include renewals, while another excludes them.
Create a metric contract for every measure that affects a decision. Record the owner, formula, time window, grain, inclusion rules, exclusion rules, CRM-stage definitions, source, refresh cadence, and known limitations. If a field is routinely incomplete, say so where the metric appears.
Data quality also needs a practical review. A NIST concept paper lists data quality factors such as accuracy, timeliness, completeness, relevance, and consistency, which you can adapt as checks for sales reporting.
Those checks should connect to the decision at hand. A dashboard can be current but incomplete, or consistent but based on a definition that no longer fits your sales motion. Fitness for purpose is the standard that keeps the discussion grounded.
Use KPI Families as a Starting Template
Your scorecard should cover the decisions your team actually owns. The following KPI families provide a starting template, not a mandatory list or a set of universal benchmarks.
| KPI family | Example decision questions | Definition cautions |
|---|---|---|
| Commercial outcomes | What was booked or recognized during the period? How does the result compare with the approved plan? | Follow your finance policy. Define currency treatment, adjustments, product scope, and period boundaries. |
| Pipeline amount and movement | How much pipeline entered, advanced, slipped, or closed during the period? | Define stage entry, stage exit, snapshot timing, reopened deals, and close-date changes. |
| Conversion and outcomes | How do stage-to-stage conversion and win or loss outcomes vary by segment? | Define cohorts, opportunity grain, stage history, time window, and treatment of inactive records. |
| Aging and cycle duration | Which opportunities have remained in a stage longer than expected for their segment? | Set expectations from your own history and sales motion. Avoid cross-company benchmarks. |
| Forecast versus actual | Where did actual results differ from the approved forecast method? | Document forecast categories, snapshot dates, overrides, and the version used for comparison. |
| Data quality | Which records are stale, incomplete, inconsistent, or outside expected ranges? | Define refresh cadence, required fields, exception logic, ownership, and remediation steps. |
A well-chosen visual can make those comparisons easier to scan, especially when you need to compare regions, periods, or metric families. Chart choice should follow the question: trends need time context, movement needs stage history, and exceptions need enough detail for investigation.
As you refine the scorecard, compare common measures with the decisions each one supports. Keep only the metrics tied to a named decision, and document how your team calculates each one.
Evaluate Sales BI in Five Parts
Feature lists make sales BI comparisons look tidy, but your real test is whether the platform supports a trustworthy path from question to action. Use five evaluation areas: decision fit, data and metric fitness, governance and access, usability and workflow, and AI assurance where applicable.
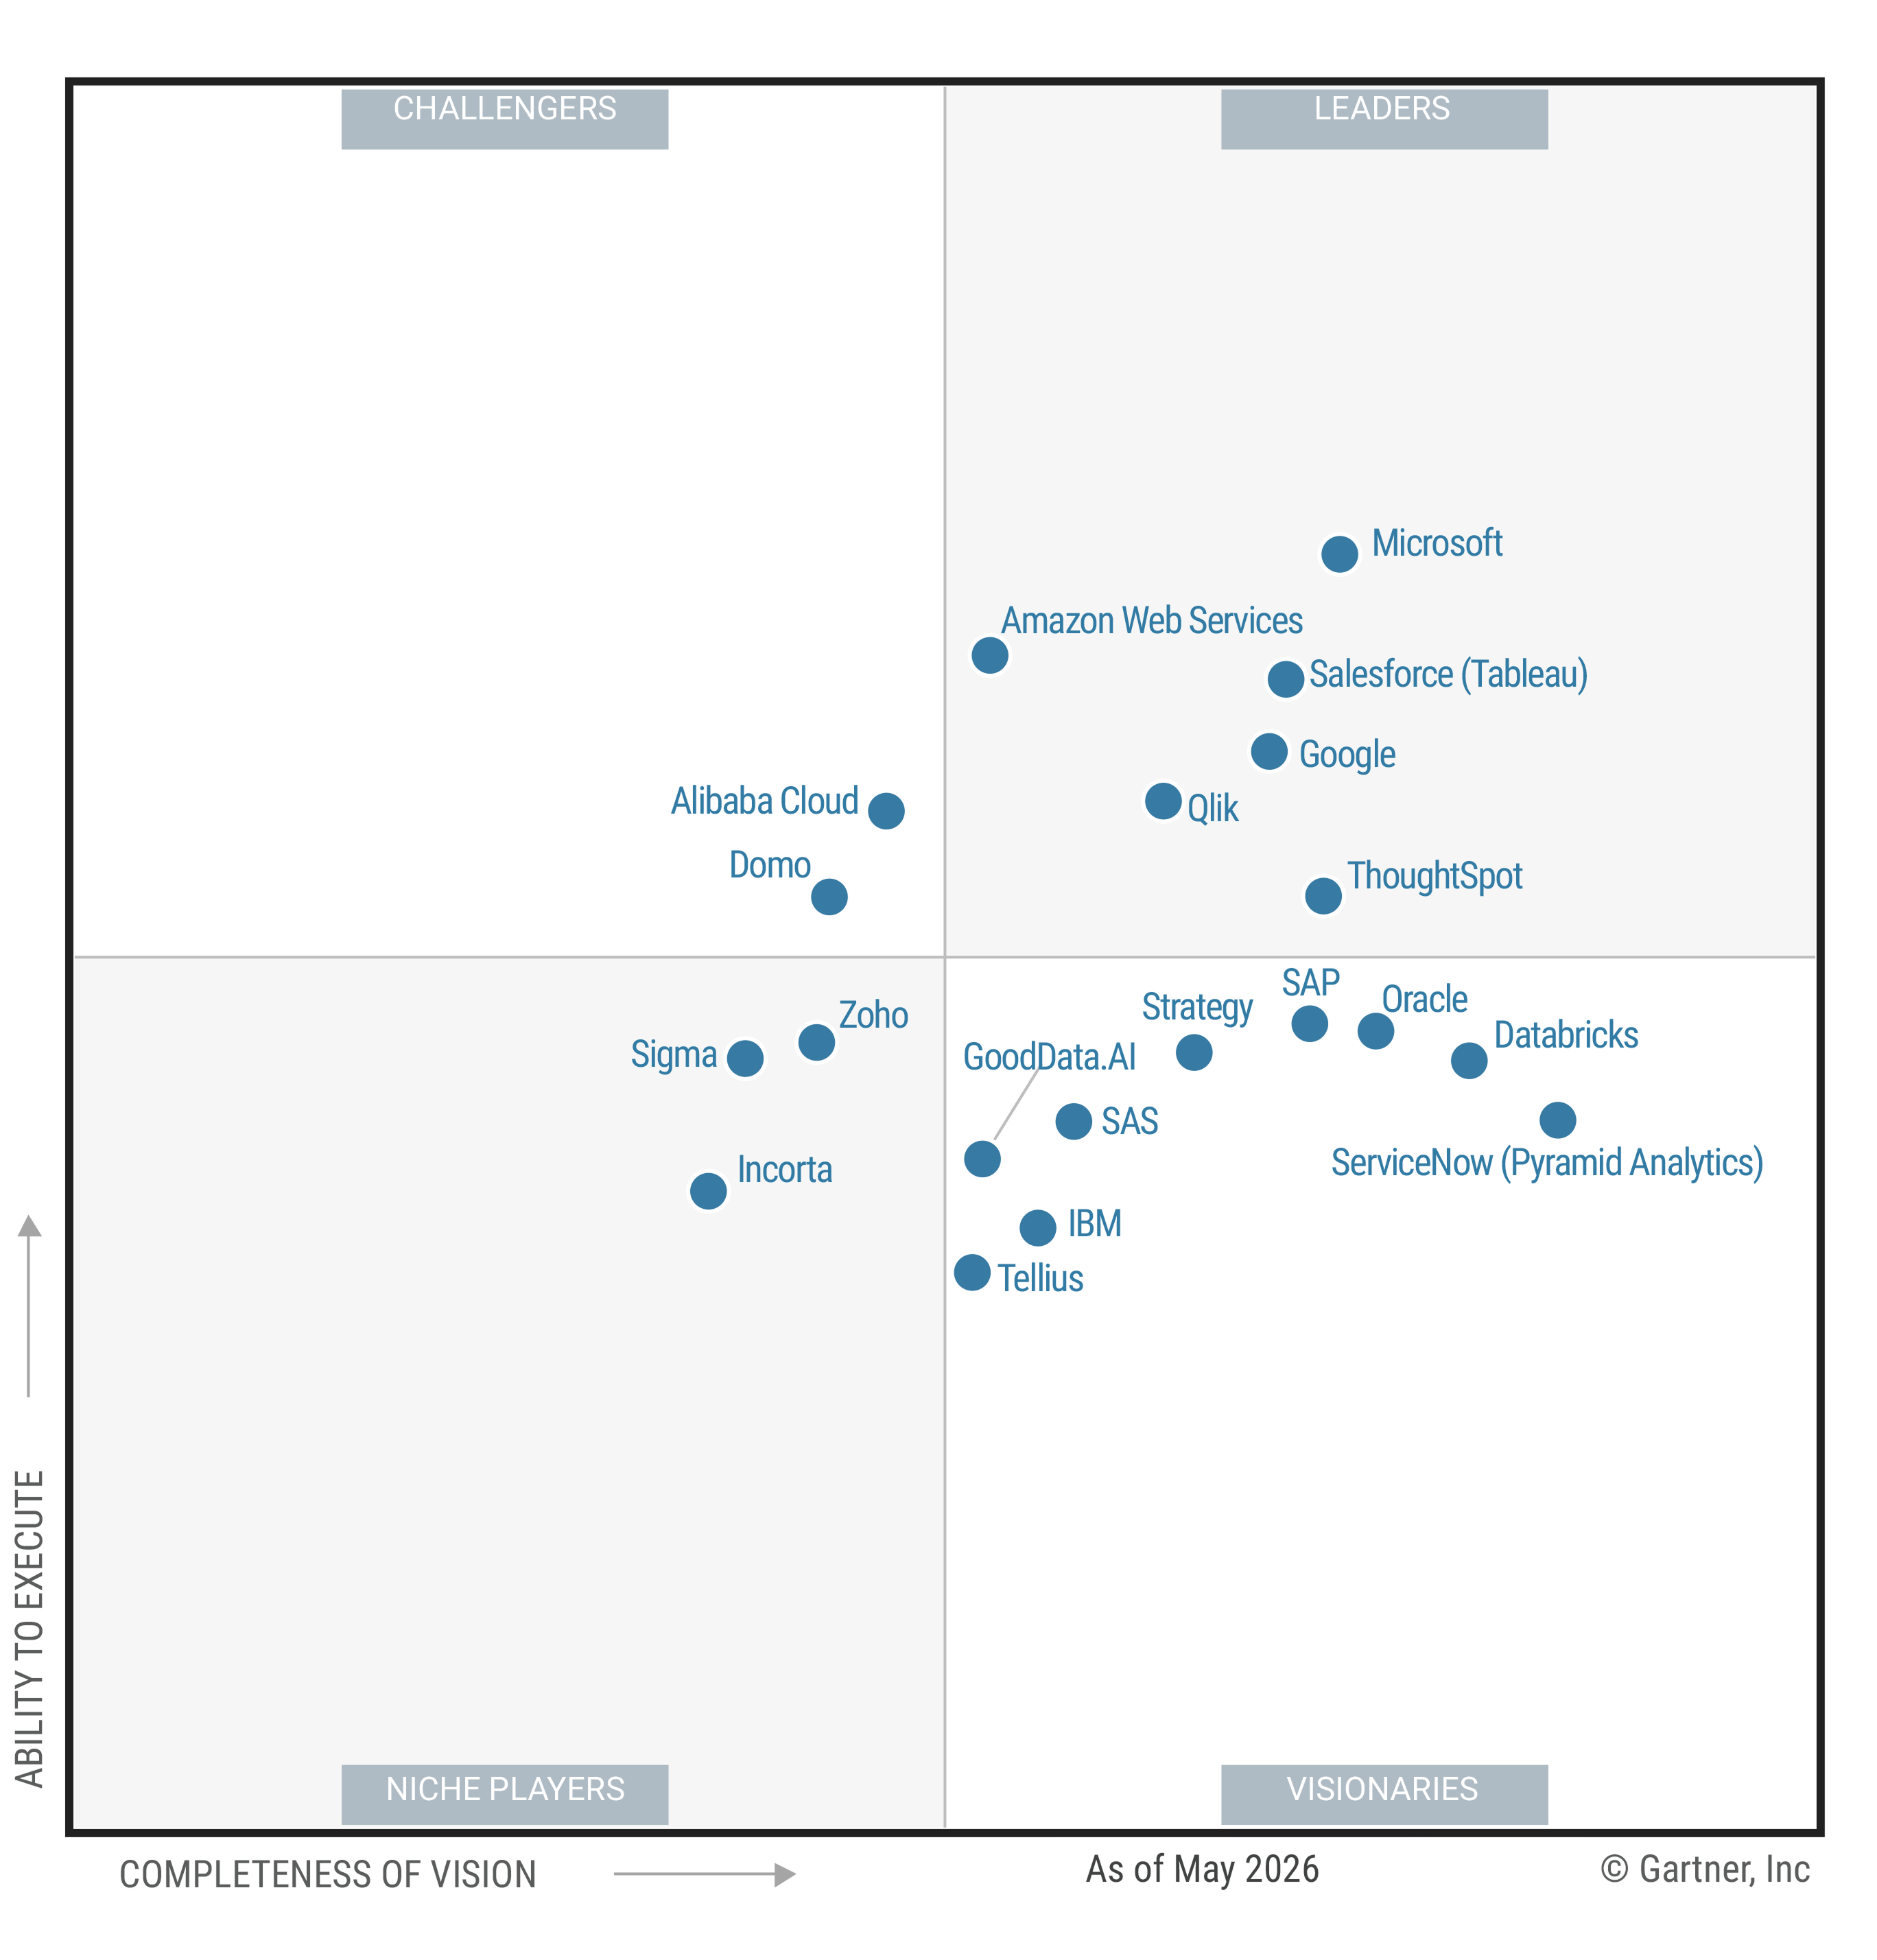
Run the evaluation with representative data and real sales questions. ThoughtSpot's enterprise analytics capabilities include interactive dashboards, drill-down, and conversational self-service. Your evaluation should still test those capabilities against your definitions, users, and operating process.
Check Decision Fit and Data Fitness
Start with a short list of recurring decisions. You might choose a weekly pipeline review, a forecast inspection, a territory check, or an analysis of changed opportunity status. For each one, name the user, input data, required metric, follow-up questions, and possible action.
Next, test the data behind the view. Is it accurate enough for the decision, complete for the chosen population, relevant to the question, current at the needed cadence, and consistent across reports? When exceptions appear, can you trace them to source fields and definition logic?
Use awkward cases, not just clean demos. Test reopened opportunities, changed account ownership, missing stages, late-arriving records, and differences between CRM and finance periods. Those cases reveal whether the analysis holds up when a meeting gets specific.
Review Governance, Access, and Workflow
Governance starts with ownership. Someone needs authority to approve metric definitions, review changes, resolve conflicts, and communicate known limitations. Your evaluation should also ask whether sensitive customer, opportunity, compensation, or forecast data is limited to authorized users under your policies.
Then follow a question through the interface. Can a manager move from a high-level pipeline view into the records behind a change? Can an analyst inspect filters and timeframe without rebuilding the analysis from scratch?
ThoughtSpot describes interactive Liveboards and analysis with drill-down, AI-assisted insight discovery, anomaly detection, change analysis, alerts, and forecasting. Test the capabilities you plan to use, and keep the approved metric definition visible throughout the investigation.
Finally, examine the handoff from analysis to work. An approved insight might be routed to a CRM record or a notification, depending on your setup and controls. Treat that handoff as a governed workflow step rather than a promise of automatic action.
Apply AI Assurance Where Generative AI Is Used
Conversational analytics can make a revenue trend easier to investigate because you can ask a follow-up question in familiar language. If the feature uses generative AI, however, the answer still needs context: metric definition, source timeframe, filters, interpreted query, applied permissions, and known limitations.
NIST's generative AI risk profile identifies confidently stated erroneous content as a risk, so you should verify material sales findings before acting. This warning applies to generative AI output, not every natural-language query method.
Before rollout, test representative sales questions and expected interpretations. During use, monitor results and document escalation paths, review ownership, and response steps for disputed findings.
Put Sales BI Into Your Operating Rhythm
Sales BI earns its place when it supports the meetings and decisions already on your calendar. For a weekly pipeline review, start with movement since the prior snapshot. Then inspect material changes, drill into affected opportunities, and document the next approved action.
The same pattern can support forecast inspection, territory analysis, or sales performance review. ThoughtSpot's sales offering is designed for pipeline clarity, performance analysis, and analysis across sources such as Salesforce and Outreach. Your data model and operating definitions determine what each view means.
The HP customer case study documents uses in pricing and bid desk analytics, partner risk management, customer performance management, and channel performance and profitability.
Your operating rhythm may be much narrower, which is often a sensible place to begin. Pick one recurring decision, define its metric contract, test the drill path, and agree on what happens when the data or answer looks wrong.
Choose Sales BI That Holds Up Under Pressure
The strongest sales BI choice is the one that stays clear when the conversation moves beyond the headline number. Shared definitions, traceable data, useful drill paths, governed access, and responsible AI review give you a firmer basis for action than a feature count alone.
Choose one recurring sales decision and test the full path from source record to approved action. Does the path remain understandable when data is incomplete or a definition changes? If so, you have a practical foundation for broader use.