- BI data integration combines source data, business definitions, relationships, and governance for analysis.
- Evaluate ETL, ELT, virtualization, APIs, and streaming against freshness, scale, and operating needs.
- Your BI access mode affects pipeline schedules, source load, and the user experience.
- A semantic layer gives teams a shared place to document business definitions and relationships.
- Quality checks and named ownership belong throughout the pipeline, not only at delivery.
BI data integration connects information from separate systems so you can analyze it through a consistent, useful view. Moving records is only the start; you also need shared definitions, reliable relationships, clear ownership, and an architecture that fits analytical use.
When those pieces work together, your teams can spend less time debating numbers and more time acting on them. This guide explains the main integration patterns, the role of data freshness, and why a semantic layer belongs in your design.
What Is BI Data Integration?
BI data integration is the process of bringing data from different sources into a usable, governed view for analysis. Those sources might include cloud data platforms, data lakes, operational databases, legacy systems, files, and selected SaaS applications.
Data integration connects, cleans, and organizes data, while BI uses the result to explore performance and answer business questions. ThoughtSpot describes its analytics offering as AI-native enterprise BI for exploring data and finding insights.
A connected dataset can still produce conflicting answers when finance and sales define active customers differently. Teams may also join orders to accounts differently or apply different date logic to the same revenue metric.
A trustworthy integration design carries business meaning with the data. Your organization should document definitions, joins, grains, security expectations, and ownership before a metric reaches a Liveboard, an AI agent, or an ad hoc analysis.
A governed semantic layer gives teams a shared place to define business concepts and relationships across datasets. In practice, that helps BI and AI experiences work from more consistent business context.
Choose the Right Integration Pattern for Your BI Needs
There is no single integration pattern that fits every workload. How do you choose? Consider processing location, freshness, source capacity, and the operating complexity your team can manage.
| Integration Pattern | How It Works | Best Fit | Main Tradeoff |
|---|---|---|---|
| ETL | Extracts data, applies processing before loading, then writes it to a target store | Curated data with defined pre-load rules | Upfront processing can add pipeline steps |
| ELT | Decide whether modeling should happen after loading | Teams that prefer to model after loading data into the target platform | Compare governance and operating needs before selection |
| Data virtualization | Evaluate whether source-based access fits the use case | Teams considering access across source systems | Requires careful testing of source responsiveness and availability |
| API integration | Evaluate defined interfaces for selected application data | Teams integrating selected application data | Plan for ongoing interface maintenance |
| Streaming | Assess whether continuous or frequent event movement is needed | Use cases where the added operating effort is justified | Requires clear monitoring and recovery practices |
According to Microsoft’s ETL guidance, ETL consolidates data from diverse sources into a unified store. Microsoft lists common operations such as filtering, sorting, aggregation, joining, cleaning, deduplication, and validation.
Use ETL when data must meet clear rules before it enters the analytical store. Consider ELT when your team prefers to model after loading data into the target platform. Let your platform, controls, skills, and workload guide the choice.
For data virtualization, test source responsiveness and availability carefully. For API integration, plan for ongoing interface maintenance.
Use streaming where the added operating effort is justified, with clear monitoring and recovery practices. Before selecting any pattern, document who will operate it, how your team will test it, and which recovery practices it requires. Record the final choice with its owner and review date.
You may select more than one pattern for different use cases. Compare each choice against the same freshness, governance, and operating criteria. Aim for a coherent architecture instead of forced uniformity.
ThoughtSpot Analyst Studio provides a practical place to prepare and model data for analysis. It also supports ad hoc exploration and data science work.
Match Freshness to How Your BI Tool Reads Data
How should the BI layer access integrated data? A snapshot or import model stays current through its latest refresh, while a direct or live-query model queries the source during analysis.
Microsoft documents this difference in its guidance on Import and DirectQuery modes. Import uses copied data that needs refreshes to reflect source changes, while DirectQuery retrieves data from the source during report interaction.
Import can give you predictable analytical performance, but you must choose refresh schedules that fit the business need. A daily refresh may work for monthly planning and fail for inventory decisions that depend on recent changes.
Live query reduces the delay between source updates and analysis, but it shifts more responsibility to the source platform. Query concurrency, model design, workload management, and source availability now shape the reader experience.
Start by naming the acceptable freshness for each decision. Then align pipeline timing, source capacity, caching choices, and user expectations with that target. ThoughtSpot Connect supports live query, cached datasets, or a mix, so teams can select an access pattern based on their data and workload needs.
Make the Semantic Layer Part of Your Integration Architecture
Moving data into one platform does not settle what the data means. If teams use different KPI formulas, relationship rules, or security filters, a shared storage location can still produce inconsistent results.
Use a governed semantic layer to document business meaning between physical data and analytical use. Your organization should record measures, dimensions, relationships, names, security expectations, and ownership in terms that match how it operates.
Consider customer, order, and product tables. Your organization should document each table’s grain, its keys, the authoritative customer record, return logic, and access expectations for sensitive fields.
Where should those choices live? Document them in the semantic layer so BI and AI experiences can work from more consistent business context.
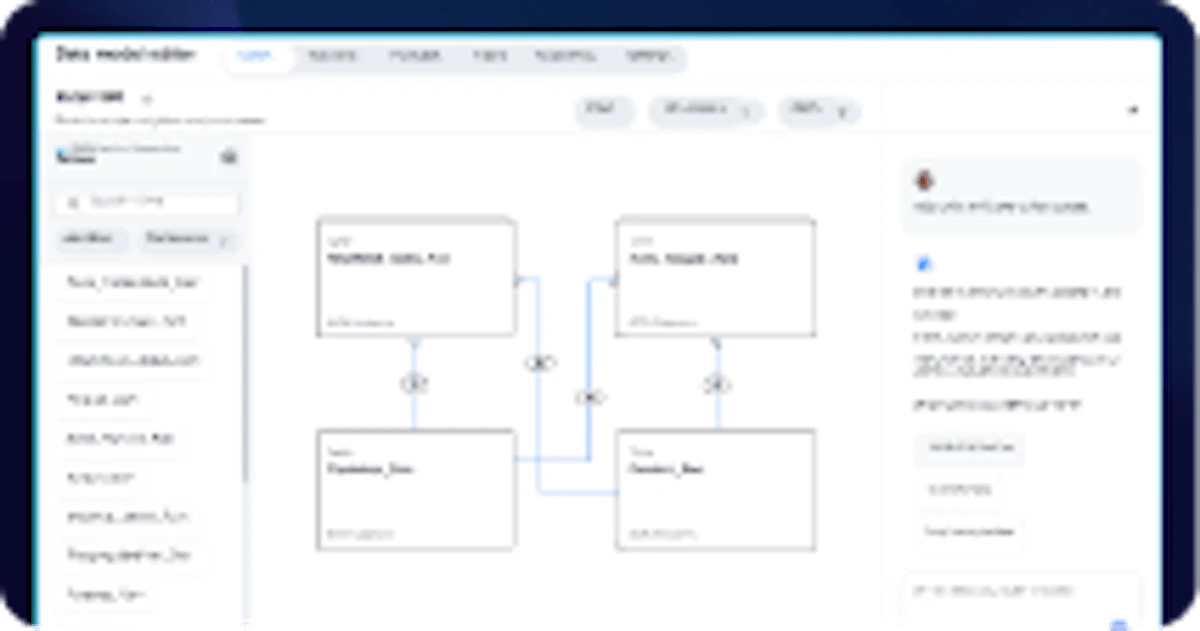
Your organization should also document row-level access expectations, approved calculations, naming conventions, and ownership details in the semantic layer. Review this documentation when source structures, access needs, or business definitions change.
ThoughtSpot’s approach to governed cloud-data analytics connects data-leadership priorities with the analytical experience teams use.
Treat the semantic layer as part of integration architecture, not a final formatting step. Use it to document business concepts before teams analyze integrated records.
Build Quality and Governance Into the Pipeline
What does good data quality mean for your use case? A customer address may be adequate for regional reporting and inadequate for delivery routing. Your controls should reflect the decisions the integrated data will support.
The Federal Committee on Statistical Methodology makes this point in its federal data-quality framework. For integrated data products, it calls for assessing source quality against purpose and evaluating linkage, modeling, and harmonization methods.
Use the following checklist to build quality and governance into the work:
Start With Business Questions. Write down the decisions, metrics, and user groups the integration must support. This keeps technical work tied to a defined purpose.
Inventory Sources and Owners. Record each source, system owner, update pattern, access method, and known limitation. Name who approves changes and resolves issues.
Document Grain, Keys, and Definitions. State what one row represents, how records join, and how each metric is calculated. Include time zones, currencies, and status logic where relevant.
Set Freshness Targets. Define how recent the data must be for each use case. Match schedules and query patterns to that requirement.
Test Mappings and Reconciliation. Compare source and target counts, totals, null patterns, duplicates, and key relationships. Investigate differences before publishing the model.
Monitor Quality and Change. Watch for schema changes, delayed loads, broken joins, unusual volume, and failed checks. Route each alert to a named owner.
Publish Ownership and Context. Show who owns the model, what it supports, when it updates, and which limitations users should know.
Quality tests should cover both technical validity and business meaning. A pipeline can complete successfully while using the wrong join, excluding a valid status, or calculating a metric at the wrong grain.
Teams can use interactive analytics dashboards to explore business metrics and visualizations.
Give change management the same attention as initial design. A renamed field, revised sales stage, or new privacy rule can affect models even when the pipeline runs. Data contracts, lineage, tests, and ownership records help teams identify that impact before users encounter conflicting answers.
Start With the Decisions Your Data Must Support
A useful BI data integration strategy starts with a decision, not a connector. Name the question people need to answer, the action that follows, and how current the answer must be.
Next, map the required sources and business definitions. Identify the grain, keys, metric logic, security context, and owner for each input. This step reveals whether the challenge is data access, data meaning, or both.
Then choose the simplest viable integration pattern. Use ETL, ELT, virtualization, APIs, streaming, or a combination based on real freshness and operating requirements. Avoid adding complexity that does not improve the analytical experience.
Finally, test with the people who will use the answers. Ask them to trace a metric, compare it with a known source, and explain the decision it supports. Their feedback can expose unclear definitions and missing context that pipeline checks alone may miss.
Successful BI data integration produces current, governed, usable answers. Planning that foundation now? See how ThoughtSpot can help you connect your data sources and apply governed models across analytical experiences.