- Small business analytics gives you a repeatable way to answer focused business questions with data you trust.
- A short KPI list tied to real decisions is more useful than measuring every available activity.
- Descriptive, diagnostic, predictive, and prescriptive analytics help you move from understanding results to comparing possible actions.
- The right platform supports governed data access, clear visual explanations, natural-language follow-up questions, and team collaboration.
When a customer, sales, or operations decision cannot wait, another spreadsheet refresh or reporting queue creates real friction. Small business analytics helps you use sales, marketing, operations, finance, and customer data to answer a focused question and choose a practical next step.
You do not need a large data team or a long technology project. Start with one decision, a few trusted measures, and a routine to review, act, and ask what comes next.
What Small Business Analytics Means for Daily Decisions
Small business analytics is the disciplined use of business data to understand performance and guide action. For you, that might mean finding where revenue changed, which campaign deserves budget, what inventory needs attention, or why customer retention moved.
The goal is not to collect the most data. It is to get a useful answer while you still have time to act, which is central to effective analytics for business leaders.
Small and lean organizations also represent a significant part of the economy. In May 2026, the U.S. Census Bureau reported that the United States had 30.4 million nonemployer establishments in 2023, generating nearly $1.8 trillion, or 6.4% of GDP.
That figure applies specifically to nonemployer establishments, rather than every small business. Still, it shows why practical analytics for small businesses matters across many owner-led and lean operations.
From Stale Reports to Timely Answers
A monthly report can tell you that sales fell. A decision-ready analysis helps you ask whether the change came from a region, product, channel, customer segment, or time period.
Consider a sales decline that appears in a weekly review. If you can explore the result while it is current, you can test likely drivers and focus without waiting for a new report.
Your existing reports can remain useful. The shift is a faster path from a visible change to an explanation and accountable action.
Start With a Decision and a Focused KPI Set
A good data strategy for small business starts with a decision, not a catalog of available metrics. Ask what you need to decide, who owns that choice, and when the answer must be ready.
Then select the smallest KPI set that can clarify the decision. Each KPI should have an owner, a definition, a source, a review frequency, and a threshold that prompts attention.
Separate outcome measures from diagnostic measures. Revenue shows what changed, while pipeline conversion, average order value, or retention helps explain why.
Match Each KPI to a Business Decision
Choose KPIs based on the action they support. For growth decisions, you might review revenue and pipeline conversion; for marketing allocation, customer acquisition cost and campaign conversion may be more useful.
Operations leaders may focus on order cycle time and stockouts. Customer teams could review retention and support volume, but these are examples rather than a universal scorecard.
A metric earns its place when someone knows what to do with it. If it never changes a discussion or action, reconsider its place in the review.
Keep Definitions Short, Shared, and Actionable
For every KPI, write a plain-language definition and the basic formula. Add its source, refresh timing, owner, and the change that should trigger a closer look.
Shared definitions prevent debates about whose number is correct. They make data governance practical by clarifying what each metric means and how it guides a decision.
Use the Four Types of Business Analytics Together
The four types of business analytics answer four questions: What happened, why, what may happen next, and what should you do? You can use them together without adopting every method at once.
Suppose weekly sales and inventory demand changed. Descriptive and diagnostic analytics explain the pattern, while predictive and prescriptive approaches help you consider what comes next.
Descriptive Analytics: What Happened?
Descriptive analytics summarizes past or current performance. Revenue, conversion, retention, order volume, and service levels can give you a clear baseline for the period you are reviewing.
Later questions need context. Compare sales with a target, prior period, product mix, or customer segment.
Diagnostic Analytics: Why Did It Happen?
Diagnostic analytics breaks a result into useful dimensions such as time, region, channel, product, or customer segment. This helps you move from a broad symptom to a more specific driver.
If sales fell, you might find that the change was concentrated in one channel while other channels held steady. That narrower finding gives your team a more useful question to investigate.
Predictive Analytics: What May Happen Next?
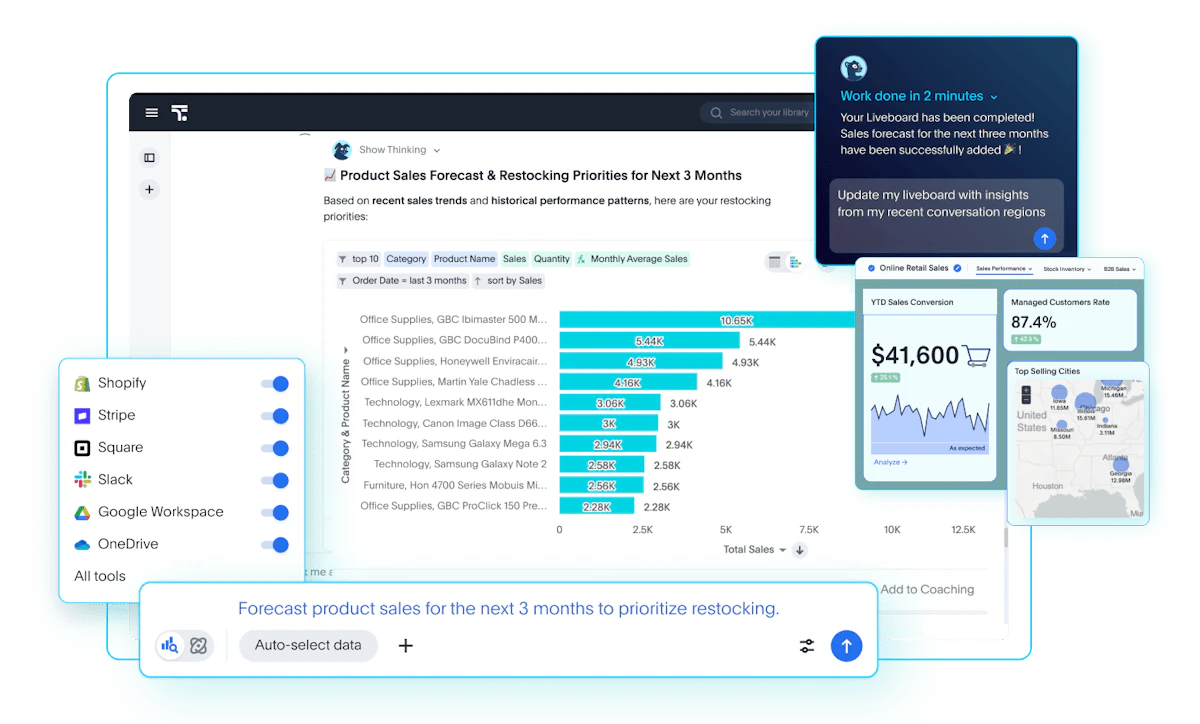
Predictive analytics uses available patterns and assumptions to estimate possible future results. A small business might use forecasting to consider demand, cash needs, or restocking pressure.
Forecasts are planning inputs, not promises. Data quality, assumptions, and changing conditions affect the forecast, especially when several connected tools supply the data.
Prescriptive Analytics: What Should You Do?
Prescriptive analytics helps you compare possible actions using thresholds, costs, capacity, and business rules. If demand may rise, for example, you could compare the cost and risk of several restocking choices.
Keep people accountable for the final decision. Analytics can organize evidence and clarify tradeoffs, but context, judgment, and responsibility still matter.
Follow a Six-Step Small Business Analytics Workflow
You can make small business data analytics manageable by following the same workflow for each decision. The process begins with a question and ends with an action, while data quality, privacy, and security stay visible throughout.
Use the workflow on one recurring decision first. A narrow start helps your team test definitions, sources, and review habits.
1\. Define the Business Question
Write one specific question with a timeframe, decision owner, and intended action. For example: “Which customer segment had the largest retention change this quarter, and what should we investigate first?”
A focused question keeps the analysis from drifting. It also gives everyone a shared standard for deciding whether the answer is useful.
2\. Name the KPI and Decision Threshold
Choose the primary KPI, define it, and state what change should prompt review or action. Your threshold can be operational, such as a stock level or conversion change, rather than statistically complex.
This step connects measurement to responsibility. Without a threshold, a team may notice movement but still be unsure whether it deserves attention.
3\. Inventory Only the Required Data Sources
List the minimum sources needed to answer the question. These may include accounting, CRM, ecommerce, marketing, support, files, or operational systems.
When one decision depends on several tools, a unified view can reduce manual reconciliation. As you assess platforms, look at whether they can connect your data sources, including cloud warehouses, lakes, legacy databases, files, SaaS applications, and APIs.
4\. Make the Data Usable and Trusted
Check completeness, duplicates, date ranges, identifiers, definitions, and refresh timing. Document known gaps, then assign an owner to fix or monitor each important issue.
A trusted answer does not require perfect data. You need to know what it supports, where it is limited, and how those limits affect the decision.
5\. Check Privacy and Security Practices
Privacy and security belong inside the workflow because analytics may rely on business and customer data. NIST says its February 2024 small-business quick-start guide gives small-to-medium organizations with modest or no cybersecurity plans considerations for starting a cybersecurity risk-management strategy. In that cybersecurity asset-management context, the guide recommends prioritizing inventorying and classifying business data.
NIST SP 800-18r2 says privacy review should consider data-processing risks, including over-collection, unauthorized profiling, or misuse of individuals’ data. It also covers external information exchanges, including cloud or web services, and notes that controls can restrict third-party sharing when appropriate. This systems-planning guidance is not legal advice or a small-business-specific checklist.
6\. Review the Answer and Act
Review the result with the people closest to the process. They can test whether the finding fits operational reality, identify missing context, and help choose the next action.
Record the decision, assign an owner, and set the next review date. The workflow creates value when the analysis changes an action or leads to a sharper follow-up question.
Turn Data Into Shared Dashboards and Follow-Up Answers
A dashboard should be a shared decision surface, not a crowded wall of charts. Give each view a clear question, a short KPI set, useful comparisons, visible definitions, and logical paths into the details.
ThoughtSpot is the Agentic Analytics Platform, and its Liveboards provide interactive dashboards with real-time drill-down from high-level views into supporting detail. Governed natural-language exploration also helps people ask follow-up questions against trusted business definitions rather than wait for another static report.
Design Each Dashboard Around a Decision
Give each dashboard one clear purpose. Use descriptive labels, appropriate chart types, comparisons against a target or prior period, and enough context for the reader to interpret movement.
A chart should earn its space by supporting a question. Adding every available measure can hide the few signals your team actually needs.
Make Follow-Up Questions Easy to Explain
A useful dashboard helps you move from “What changed?” to “Where?” and “Why?” Filters and drill-down paths can narrow the result, while plain-language questions can make exploration more accessible.
Trust still depends on explainability, shared definitions, and governed access. People should understand the result, its supporting data, and their permissions.
Choose a Platform and Build a Sustainable Decision Cadence
Avoid choosing a small business analytics platform from a generic feature list. Begin with your real question, representative data, current budget, required sources, and the people who need to explore the answer.
Evaluate cost at your current scale, data-source access, ease of use, interactive visualizations, follow-up questions, governed definitions, permissions, collaboration, support, and room to grow. A platform should fit the way your team makes decisions, rather than adding another reporting queue.
A small business may not need a full-time data analyst at the start. This approach works best when ownership, definitions, data quality, and tools are clear. Bring in outside expertise as complexity or risk grows.
Platform Selection Checklist
Use one real business question and representative data during your evaluation. Then review the platform against these criteria:
Decision fit: Can your team answer the question and explore likely follow-ups?
Total cost: Does pricing fit current use and reasonable growth?
Data access: Can the platform work with the sources required for the decision?
Usability: Can business users explore results without a long reporting handoff?
Visualization: Can people move from a summary into supporting detail?
Governance: Are definitions, permissions, and access controls clear?
Collaboration: Can your team share context, questions, and decisions?
Support: Is practical help available when your needs become more complex?
A Repeatable Weekly or Monthly Review
A simple decision cadence keeps analytics connected to action. Review the selected KPIs, explain material changes, ask one follow-up question, choose an action, assign an owner, and revisit the result at the next meeting.
ThoughtSpot describes automated analytics as a way to surface insights for business decisions. Use automation to help prioritize what deserves review, while accountable people still decide what happens next.
If your team needs faster access to governed answers, interactive Liveboards, and conversational questions backed by trusted business definitions, request a ThoughtSpot demo. Bring one real decision and its required data sources so you can evaluate the experience against your operating needs.
Build a Decision Routine Your Team Can Sustain
Useful small business analytics starts with a focused question, a trusted KPI, and a repeatable action loop. You can begin with modest resources, learn from one recurring decision, and add sophistication as your questions and data needs grow.
The strongest routine is the one your team can follow consistently. Define the measure, review the answer, ask what changed, choose an action, and return to the result with better context next time.