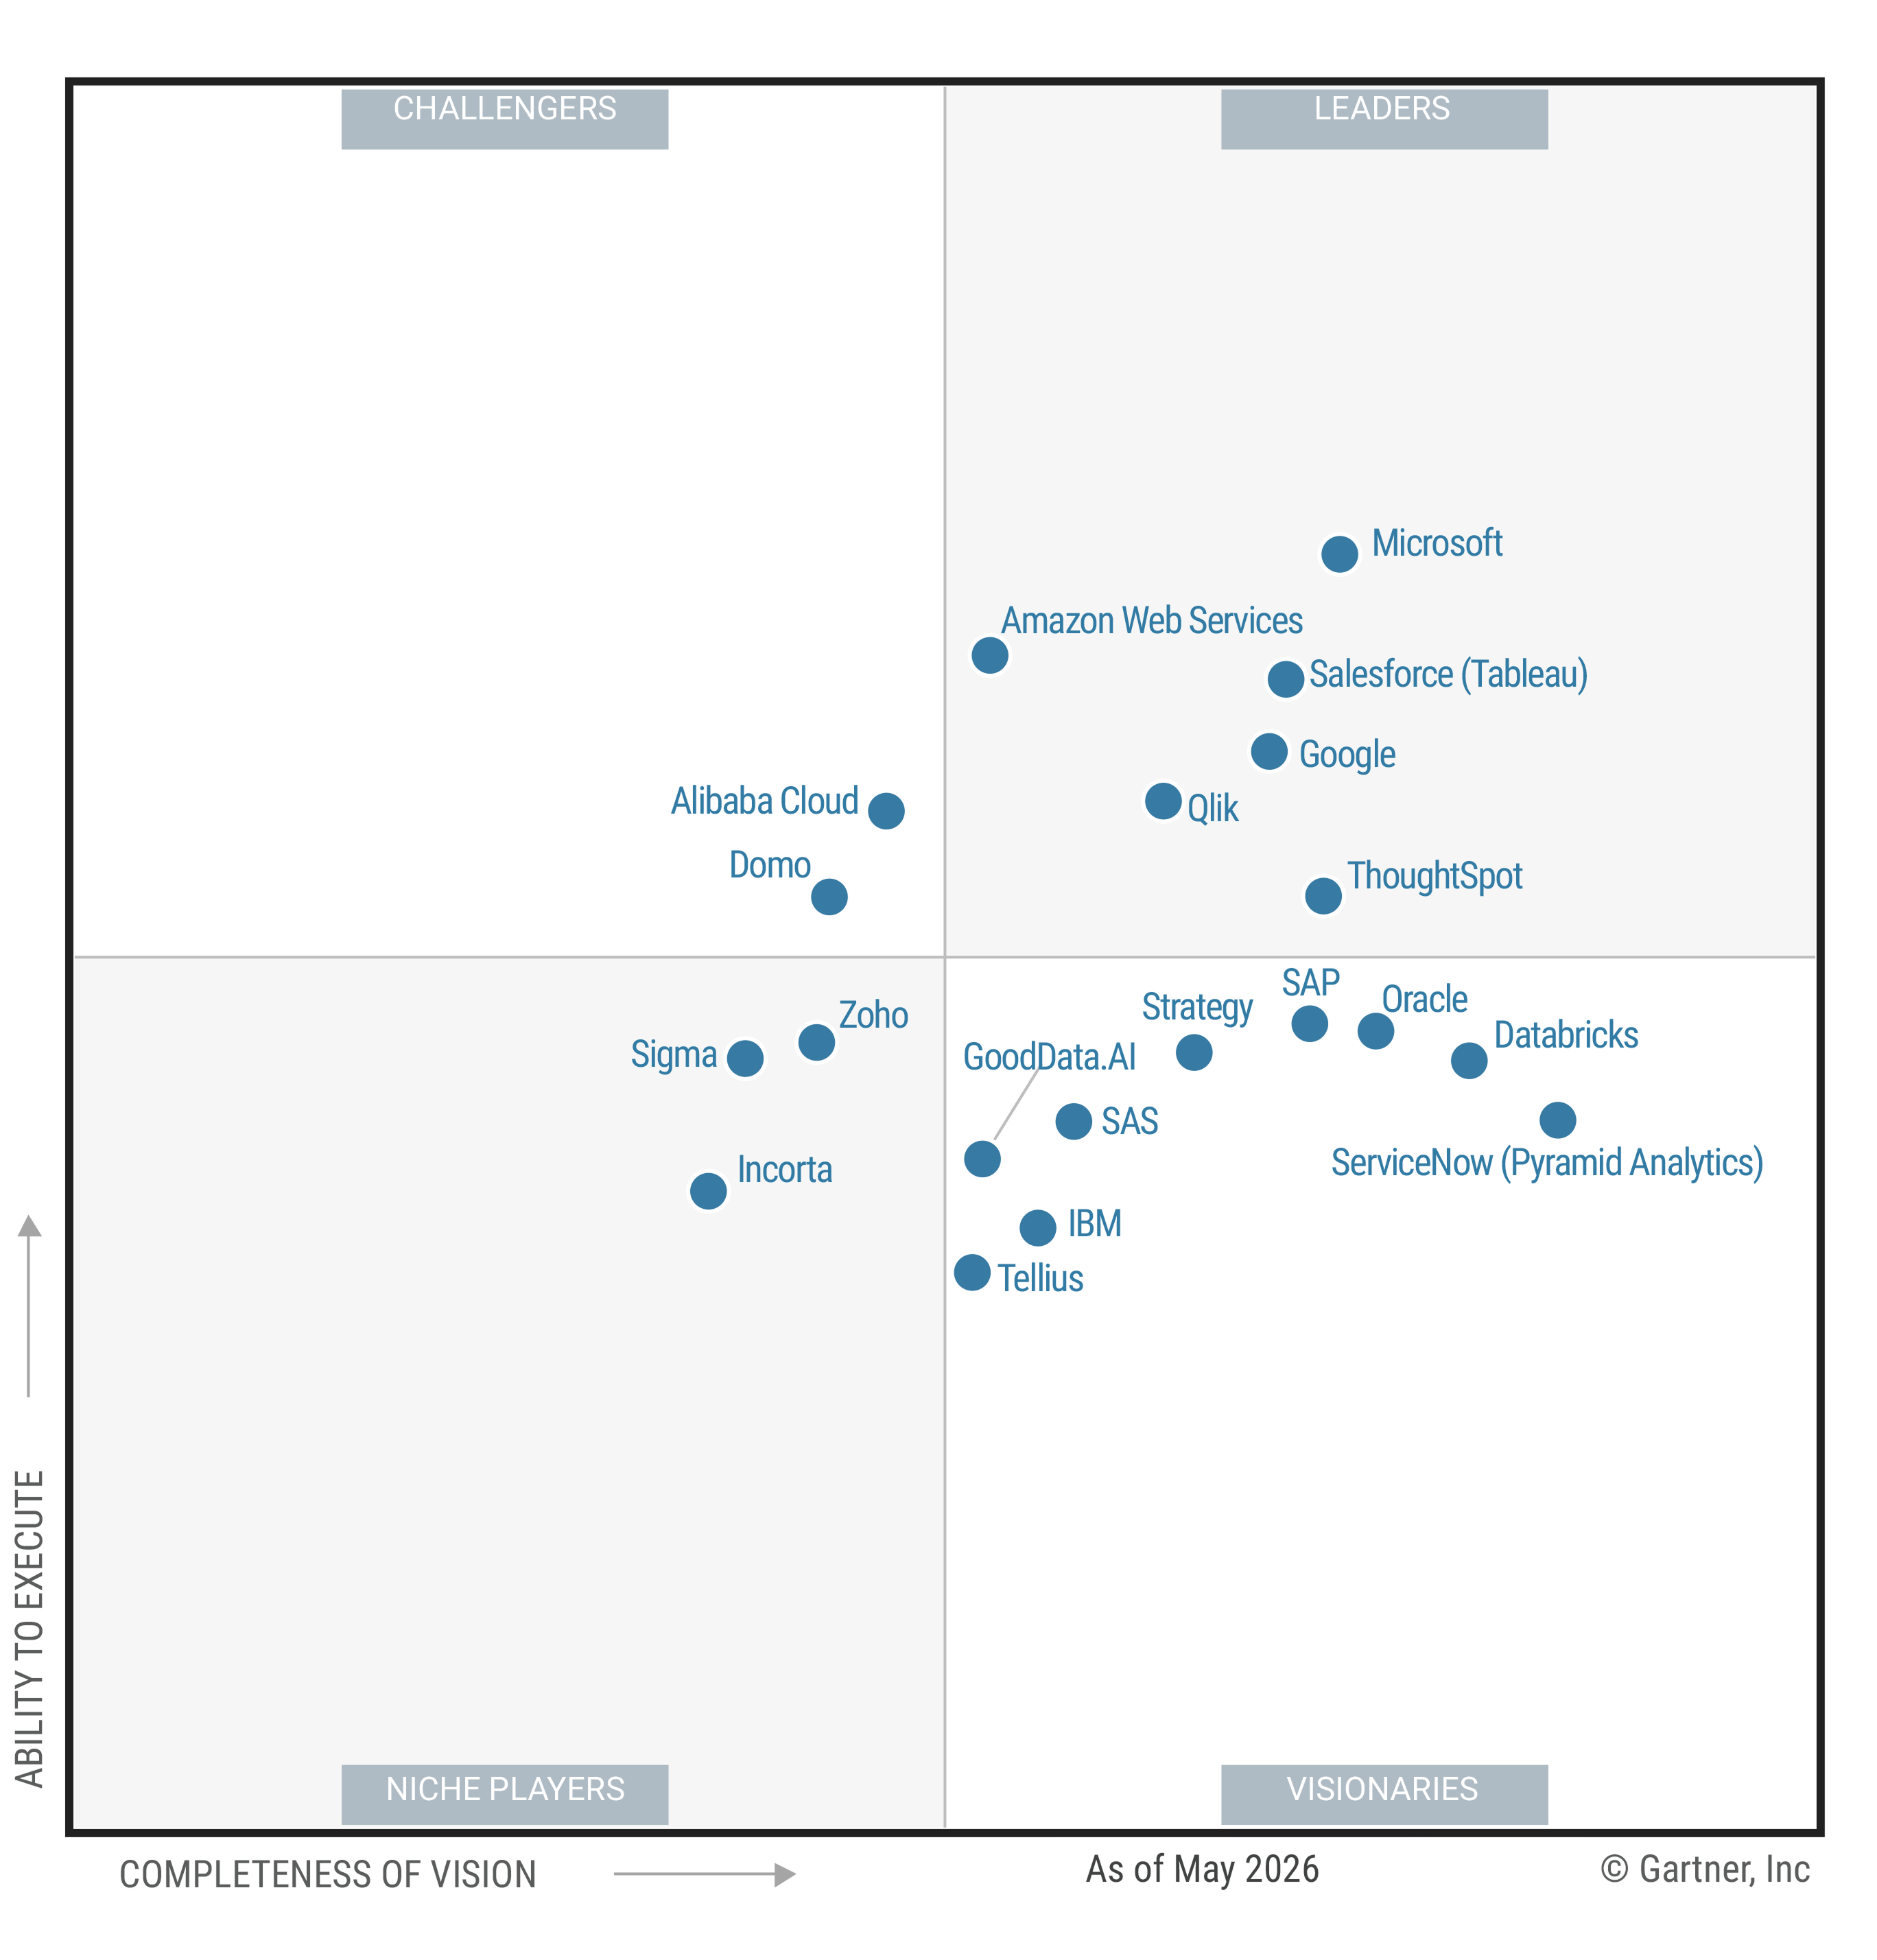
- Treat digital media analytics as a decision discipline, with every metric tied to a question, owner, and possible action.
- Measure performance through four layers: delivery quality, audience and exposure, engagement and behavior, and business outcomes.
- Document definitions, source limits, freshness, and changes so your stakeholders can interpret results consistently.
- Judge platforms by decision fit, governance, transparency, and operating ownership rather than dashboard volume.
Your channel dashboards disagree, campaign labels drift, and the ROI question still lands on your desk. ANA reported that 53% of respondents in a survey of roughly 95 marketers faced cross-channel measurement challenges when optimizing across channels.
In this article, digital media analytics means using paid, owned, and earned media data with relevant business systems to answer explicit questions. A four-layer framework helps you separate delivery, audience, engagement, and business outcomes before deciding what the evidence supports.
What Digital Media Analytics Should Help You Decide
A useful analytics practice starts with a decision, not a dashboard. Where should you adjust spend, which audience needs different messaging, or where is qualified demand dropping from the funnel?
For this article’s framework, web analytics covers site or app behavior, while digital media analytics also connects agreed media and business-data sources.
That broader scope still needs boundaries. Activity reports can show what happened, but they cannot tell you what action to take without a defined objective, comparison, and decision owner.
Before adding a metric, ask three questions: Who will use it, what decision can it change, and what evidence would alter that decision? If nobody owns the response, the metric is probably reporting inventory rather than decision support.
Measure Performance in Four Layers
A single KPI rarely carries enough context for a defensible conclusion. Instead, use four layers that show where evidence becomes stronger and where each measure stops short.
| Measurement Layer | Question to Answer | Example Measures | What It Cannot Prove Alone |
|---|---|---|---|
| Delivery quality | Was the media delivered under the agreed conditions? | Served impressions, viewable impressions, invalid traffic rate, placement, frequency | Human attention, audience quality, conversion, or business impact |
| Audience and exposure | Which defined audience had an opportunity for exposure, and how often? | Reach, frequency, audience composition, on-target rate, exposed population | Message comprehension, engagement quality, causality, or financial return |
| Engagement and behavior | What actions followed across media, site, or app touchpoints? | Click-through rate, video completion, engaged sessions, content depth, conversion rate | Incremental impact, customer value, or whether media caused the action |
| Business outcomes | Which agreed commercial or operational results are associated with the activity? | Qualified pipeline, sales, retention, customer acquisition cost, return on ad spend | Causality without suitable design, transparent attribution, and stated assumptions |
The Media Rating Council's MRC measurement guidance calls viewable impressions a minimum qualifying unit for digital audience-based measurement. The standard also says viewability should not imply that a person was present, so treat it as delivery quality rather than attention.
Every KPI also needs a denominator, time window, population, and decision owner. For example, “conversion rate” remains ambiguous until you state which conversions, divided by which eligible population, during which period.
Definitions should also record channel scope and exclusions. Does reach cover people, devices, households, platform accounts, or modeled identities, and how does deduplication work across sources?
When reviewing any analytics platform, assess how it represents shared measures and access rules.
Build a Data Foundation Before You Build Another Dashboard
When sources disagree, another visualization adds polish without resolving the dispute. A short operating workflow helps you identify where numbers enter, change, and acquire business meaning.
Collect: Inventory website, app, search, advertising, social, email, CRM, and sales sources. Record owners, access methods, refresh schedules, and known gaps.
Connect: Map campaign IDs, account IDs, content IDs, and approved identity keys. Document where cross-device or cross-platform deduplication remains limited.
Define: Set UTM and campaign naming standards, calculation logic, denominators, attribution windows, populations, exclusions, and decision owners.
Validate: Check freshness, missing records, duplicates, schema changes, invalid traffic, and unexplained breaks. Compare important totals with source systems.
Review: Maintain a change log, revisit definitions on a schedule, and record how decisions used the measures.
The U.S. Census Bureau's data quality dimensions include relevance, accuracy, timeliness, accessibility, interpretability, coherence, and institutional environment. Because the standard governs Census statistical information, use those dimensions as an adapted quality-control lens rather than a marketing mandate.
Applied to media data, relevance asks whether a source answers the stated question. Coherence asks whether definitions remain comparable across channels and time, while interpretability asks whether stakeholders can understand the metric and its limits.
Governance should make approved data easier to use without weakening common definitions. Could a stakeholder trace a dashboard number to its source, calculation, refresh time, owner, and change history without opening five tickets?
After the foundation exists, evaluate whether an interface supports governed exploration of approved measures.
Turn Metrics Into Decisions, Not More Reporting
A metric becomes useful when it leads to a documented choice. Start by spotting a material change, then test plausible drivers across channel, audience, creative, placement, geography, and time.
Next, validate the source and its limitations before assigning a cause. If the signal holds, name an owner, choose the next action, set a review date, and record what happened.
If a monitoring system surfaces an unusual movement, trace it to the underlying source data and metric definitions before acting.
Use Anomaly Detection as a Starting Point
Suppose return on ad spend falls 18% week over week. Before changing budget, ask whether tracking changed, channel mix shifted, creative rotated, audience composition moved, seasonality mattered, or revenue data arrived late.
An anomaly flags a difference from an expected pattern; it does not establish why the difference occurred. Your investigation still needs data checks, useful segments, business context, and a clear statement of uncertainty.
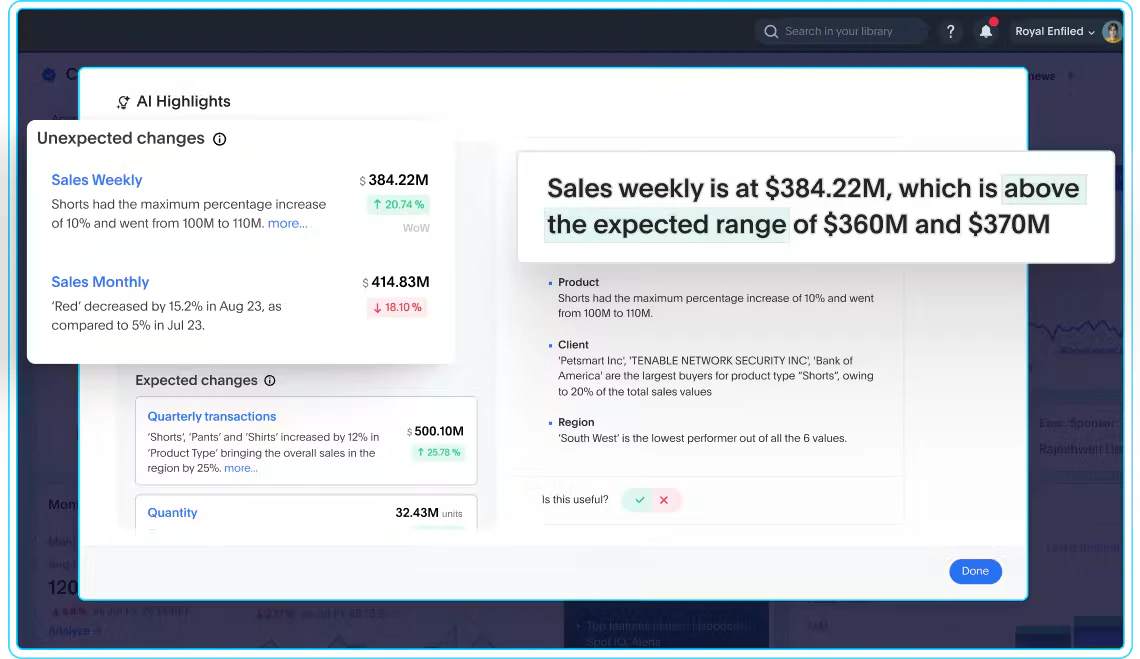
Use the signal to narrow your next question. Which segment accounts for the movement, when did the break begin, and does the pattern persist after correcting source or timing issues?
Evaluate Digital Media Analytics Tools by Decision Fit
Feature lists can become a distraction when your real problem is unclear measurement logic. The following scorecard is an editorial buyer framework, not a universal industry standard.
Business-question fit: Can the platform address your priority allocation, audience, funnel, and outcome questions?
Metric and semantic controls: Can owners define calculations, dimensions, access, and approved terms consistently?
Source coverage: Does it work with the systems required for your stated scope?
Data-quality documentation: Can users see freshness, lineage, limitations, changes, and ownership?
Privacy review: Can you document processing, risks, requirements, target outcomes, gaps, and residual risks?
Method transparency: Are sampling, modeling, identity, attribution, and automated methods explained clearly?
Interoperability: Can the platform fit your data architecture and exchange governed context where required?
Operational ownership: Who administers definitions, access, incidents, releases, and user support?
Cost: What will implementation, operation, usage, training, and change management require?
NIST's voluntary NIST Privacy Framework guidance advises organizations to account for processing activities, privacy risks, privacy values, and legal requirements. It also recommends evaluating partners against specified privacy outcomes, known gaps, and residual risks.
That guidance supports privacy risk management, not a compliance certification or legal opinion. Your procurement process may also need legal, security, data governance, and business owner review based on the use case.
No platform can repair undefined metrics or weak source data by itself. Before buying, test representative questions with your data, expected definitions, access rules, and exception cases.
If analytics must appear inside another product or workflow, include that requirement in the evaluation.
Make Measurement a Team Habit
Your durable advantage comes from shared definitions, layered evidence, and a regular decision review, not another row of dashboard tiles. Keep the cadence simple: review material changes, test explanations, assign actions, and record what the evidence could and could not support. If you want to discuss how ThoughtSpot fits your measurement requirements, request a ThoughtSpot demo.