- Digital analytics connects behavior across websites, apps, campaigns, products, and customer journeys to questions you can act on.
- A useful measurement practice starts with a defined outcome, then selects a focused set of leading and lagging measures.
- Trusted analysis depends on documented definitions, clear ownership, access controls, source context, and regular validation.
- Monitoring tells you what changed. Interactive exploration helps you ask where, when, and for whom the change happened.
- A repeatable rhythm links each signal to investigation, a responsible action, and a later review of what changed.
You probably have plenty of metrics, yet a simple question can still trigger a week of debate. Which number is right, what caused the change, and who should respond?
Digital analytics gives you a practical way to answer those questions with evidence from digital touchpoints. You connect measurement to an outcome, investigate changes with trusted data, act with clear ownership, and review the result.
What Is Digital Analytics?
Digital analytics is an editorial working term for collecting, measuring, analyzing, and interpreting data from digital touchpoints. Those touchpoints can include websites, apps, campaigns, products, transactions, support interactions, and connected customer journeys.
The purpose is decision support, rather than reporting for its own sake. A useful practice helps you move from “What changed?” to “What should we examine next, and who will decide what follows?”
The US General Services Administration’s Digital Analytics Program uses one tool for measuring digital traffic and engagement across federal government websites. That public-sector example is narrow, so you should not treat it as a universal enterprise definition.
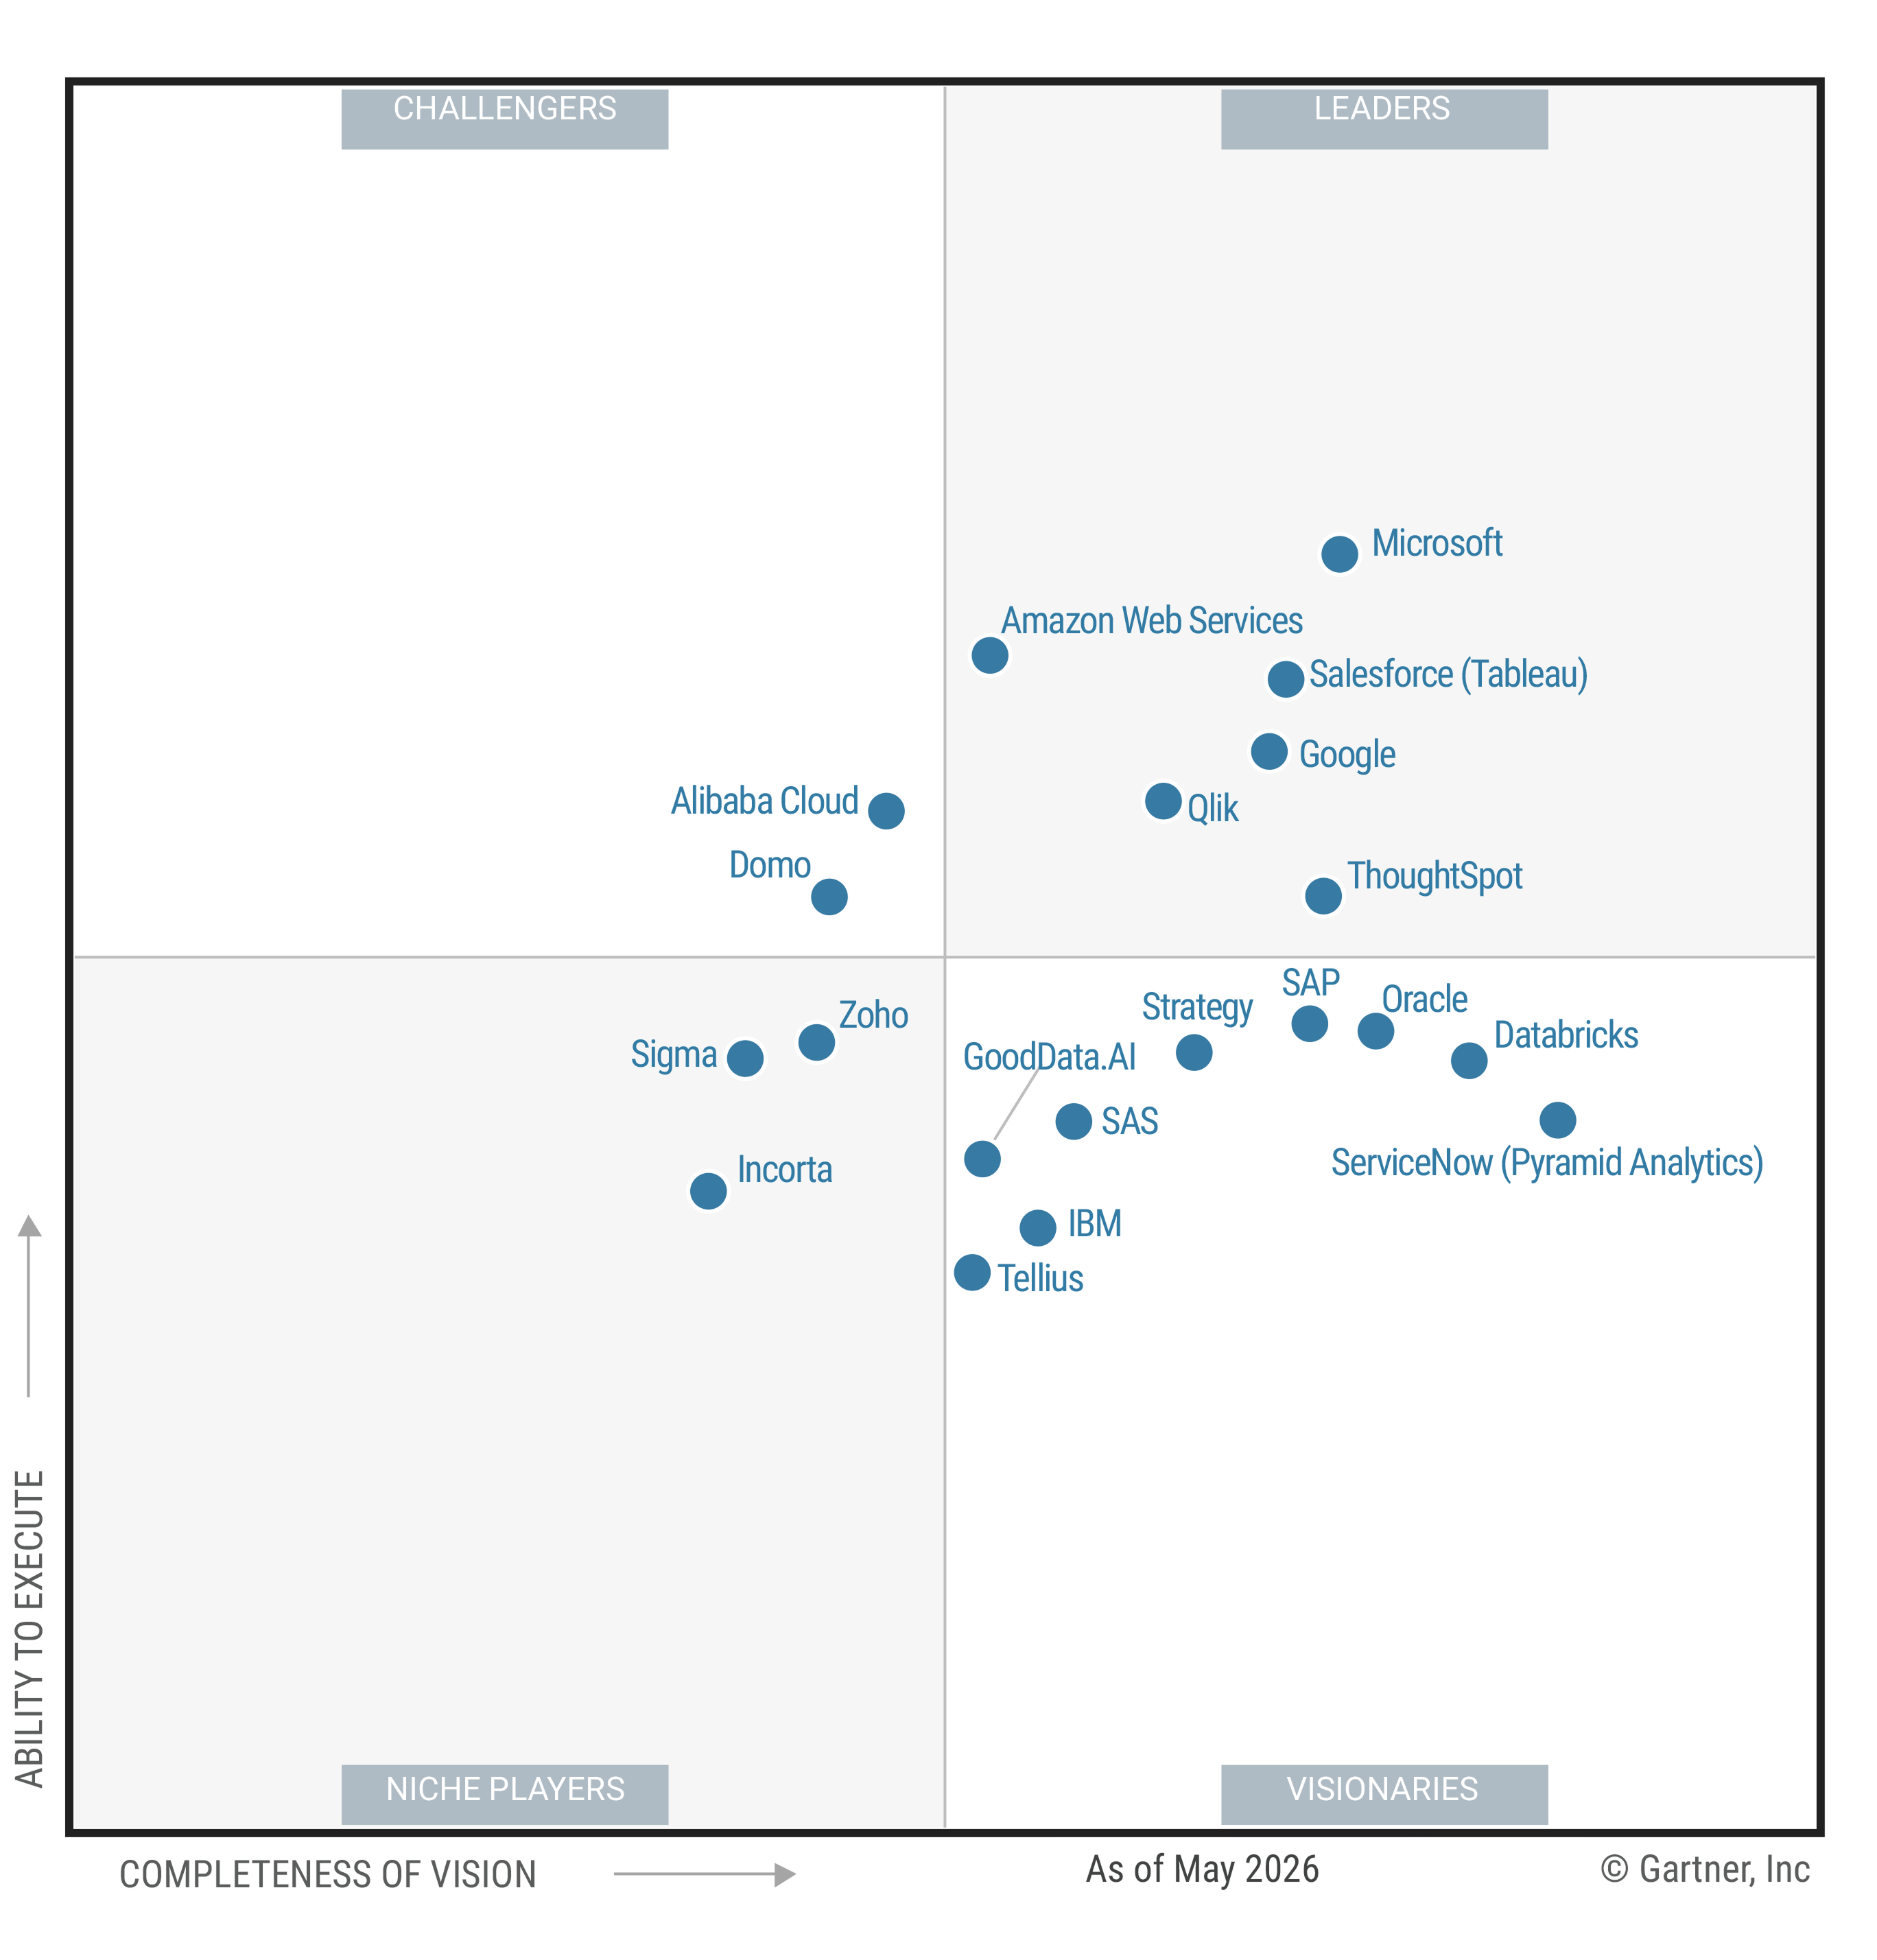
For enterprise leaders, the working scope is broader because a business question may cross several systems and functions. ThoughtSpot presents its enterprise business intelligence platform as one first-party perspective on connecting governed signals for analysis.
How Digital Analytics Differs From Adjacent Disciplines
Several analytics disciplines overlap, but each starts with a different question. The distinctions help you choose the right data and workflow without asking one system to cover every need.
| Discipline | Core Question | Common Data | Example Decision |
|---|---|---|---|
| Web analytics | How are people using a website? | Visits, traffic sources, page paths, and site interactions | Investigate which page or source contributed to a traffic change |
| Product analytics | How are people using a product or app? | Events, feature use, activation steps, and repeat use | Examine where users stop during activation |
| Marketing analytics | How are campaigns performing? | Campaign interactions, acquisition sources, and conversions | Compare campaign segments before changing spend or messaging |
| Business intelligence | What do governed, cross-functional measures say about the business? | Product, marketing, sales, finance, support, and operational data | Compare a KPI across regions, segments, or time periods |
Digital analytics can draw from all four disciplines when a decision crosses touchpoints. For example, a conversion change may involve campaign source, site behavior, product activation, and later support contact.
ThoughtSpot discusses interactive, drillable dashboards in its first-party product positioning. Whatever platform you assess, treat the dashboard as a starting point for inquiry, not the final answer.
Start With Outcomes, Then Choose Metrics
A dashboard cannot tell you what matters until you define the outcome behind it. Start by naming the decision you expect a person to make, then identify the measures that can inform that decision.
The US General Services Administration’s public-sector analytics measurement guidance says: “Before you begin collecting data, determine what your website is ultimately trying to accomplish.” The advice applies to US government websites, so treat it as a planning principle rather than a private-sector benchmark.
You can adapt that principle without treating federal website guidance as a private-sector benchmark. Use five steps: name the decision, define the outcome, select leading and lagging measures, set a review cadence, and assign an owner for action.
Avoid universal thresholds because the evidence does not support a single target across industries or business models. Your baseline, customer journey, operating model, and decision window all shape what a meaningful change looks like.
| Outcome Area | Example Measures | Decision the Measures Can Inform |
|---|---|---|
| Acquisition | Qualified visits, source mix, and acquisition volume | Where should you investigate a change in incoming demand? |
| Activation | Completion of defined onboarding or first-use steps | Which step or segment needs closer review? |
| Engagement | Repeat visits, feature use, or meaningful interactions | Which behaviors merit follow-up analysis? |
| Conversion | Completion of a defined business action | Where and for whom did conversion change? |
| Retention | Repeat use or continued customer activity | Which cohort shows a change in ongoing use? |
| Service quality | Support contacts or completion of a service task | Which journey may be creating added effort? |
Leading measures can show movement before the final outcome appears, while lagging measures record the outcome itself. Review both together, since a single metric rarely explains why behavior changed.
For a vendor perspective on the category, review ThoughtSpot’s augmented analytics overview. Treat the page as first-party positioning, while a person still tests context, weighs tradeoffs, and decides what action is appropriate.
Choose Metrics That Lead to a Decision
Vanity reporting starts with whatever is easy to count. Question-led measurement starts with the choice in front of you, then asks which signal would change that choice.
Suppose traffic drops. Before changing a campaign, compare sources, audiences, pages, time periods, and tracking health to learn where the decline occurred.
If activation falls, break the journey into defined steps and compare relevant user segments. The next question is whether the change is concentrated in a step, cohort, device, or release period.
A shift in repeat use calls for cohort and time-period comparisons, not an immediate conclusion about retention. Likewise, rising support contacts should be segmented by issue, journey stage, product area, and customer group before you respond.
Each example follows the same discipline: segment, compare, investigate, and then act. The metric points to a question; it does not supply a cause by itself.
Build a Reliable Digital Analytics Foundation
When definitions differ across dashboards, meetings turn into debates about arithmetic. A reliable foundation gives everyone the same terms, source context, ownership, and rules for interpreting a measure.
Start with clearly defined events and business entities. Document what each event records, which entity it describes, when it fires, which source owns it, and how changes are approved.
Next, maintain a metric dictionary that records formulas, filters, time logic, exclusions, owners, and intended use. Pair those definitions with source documentation, access controls, lineage, freshness expectations, and a regular validation schedule.
Make your quality expectations explicit before a data issue reaches a dashboard. Record acceptable freshness, required fields, reconciliation steps, known limits, and the owner who reviews a failed check.
Governed definitions reduce avoidable arguments because people can inspect what a number means before using it. That context also matters when an AI system interprets a request, since the same phrase can carry different business logic across teams.
For ThoughtSpot’s first-party perspective on governance and leadership, review ThoughtSpot’s data leader resources. Use the vendor material as an input while you assess definitions, access, and ownership for your own practice.
Connect Data Sources Without Losing Context
Your analysis may draw from website and app events, customer relationship management records, support systems, campaign platforms, transactions, and operational data. Combining those sources can help you follow a question across a journey, but source count alone says little about analytical value.
Preserve the business definition attached to each field and measure as data moves between systems. Keep permissions, freshness, source ownership, and lineage visible so a reader knows what the data represents and when it was updated.
A customer identifier offers a simple example. If one system records an account and another records a user, document how those entities relate. Add transaction records only after you define their connection.
Integration choices should follow the decision you need to support. Add a source when it contributes relevant context, rather than because more data appears more complete.
Regular validation should test both collection and interpretation. Check whether events still fire as documented, joins still match the intended entities, and metric logic still reflects the approved definition.
Turn Analysis Into an Ongoing Operating Rhythm
A mature practice needs a repeatable rhythm: monitor, investigate, decide, act, and evaluate. Each stage has a different purpose, and skipping one can turn a useful signal into an unsupported conclusion.
Monitoring tells you that a measure changed. Investigation checks the data, locates the change, compares meaningful segments, and develops explanations that you can test.
Decision and action remain human responsibilities because evidence does not choose your priorities or tradeoffs. Evaluation then asks what happened after the response, while avoiding a causal claim unless the design supports one.
Consider a decline in conversion. First, validate instrumentation and metric logic, then locate where the decline occurred by journey step, audience, channel, device, geography, or time period.
Next, compare related signals and document plausible drivers. Choose a response with an owner and review date, then monitor the relevant measures while noting other changes that may affect interpretation.
The US Government Accountability Office provides a public-sector example in its report on using evidence for program improvement. Issued July 22, 2026, the report says some federal agencies use evidence for program improvement and policy development. That wording preserves its limited scope and prevalence.
The lesson is modest but useful: evidence can inform a response when people retain accountability for the choice. Strong experiment design can add confidence, yet the available evidence does not support claiming that analytics automatically improves an outcome.
Give Teams a Path From a KPI to Its Drivers
A key performance indicator (KPI) is most useful when you can follow it into the factors associated with change. Start with the measure, then break it down by segments that match the decision you are considering.
Ask follow-up questions in a deliberate order. Where did the change occur, when did it begin, which groups were affected, and what related measures moved during the same period?
Compare time periods that fit the operating cycle, and record filters or exclusions that could alter the result. When you reach a decision, document the evidence used, the owner, the action, and the date for review.
A useful product evaluation asks whether people can move from a signal to its possible drivers without losing definitions or permissions. ThoughtSpot uses the phrase ask governed questions of live data in its Spotter product overview.
Treat that page as first-party positioning for the Agentic Analytics Platform. Then assess the approach against your metric logic, access model, data sources, and decision process.
Build a Digital Analytics Practice That People Use
A usable digital analytics practice can be summarized in six operating principles. Use them as a checklist for your operating model:
Start with an outcome and the decision it should inform.
Keep the metric set focused on measures tied to that outcome.
Document definitions, formulas, filters, owners, and intended use.
Validate collection, joins, freshness, permissions, and metric logic.
Give people a route from a signal to segments and possible drivers.
Review what changed after action, without claiming causality the design cannot support.
The right technology can support these habits, but it cannot replace ownership or judgment. Look for a governed workflow where people can monitor a measure, ask follow-up questions, and retain the context behind each answer.
Adoption also depends on fitting analysis into real decisions. Set a cadence that matches the work, invite the people who own the response, and record what they decided to review next.
ThoughtSpot positions its Agentic Analytics Platform around governed exploration, interactive analysis, and Spotter. To evaluate that first-party positioning against your data and decision process, see ThoughtSpot in action.
Conclusion
The measure of a digital analytics practice is whether you can turn a trusted signal into a better next question and a responsible next action. A focused set of governed measures will usually serve you better than a sprawling collection of dashboards that nobody uses.
Start with one decision that matters, document the measures behind it, and give the owner a clear path from monitoring to investigation. Then review what changed and refine the practice with the same care you apply to the data.