- Connect data with context: In this guide, analytics integration means bringing sources together so you can analyze related activity with consistent meaning.
- Match the pattern to the need: In this guide, compare ETL, ELT, APIs, and live access by preparation, freshness, cost, and governance requirements.
- Define the business logic: Shared metrics, identifiers, joins, access rules, and quality tests make integrated data useful and trustworthy.
- Start with a focused decision: A clear question, named owners, and practical controls help you build a foundation that can grow.
Your customer, finance, product, and support data may all be accurate on their own. The trouble starts when you need one answer across them, but identifiers, definitions, and update schedules do not line up.
In this guide, analytics integration means connecting and preparing those sources for analysis in context. You will need the right movement pattern, clear business definitions, quality controls, and an analytics layer people can understand.
What Is Analytics Integration?
In this guide, analytics integration means connecting data from multiple sources and preparing it for analysis as a related whole. Your sources might include a customer relationship management system, finance platform, product database, support system, cloud warehouse, files, or application programming interfaces (APIs).
In this guide, a one-time transfer does not count as analytics integration by itself. You still need matching identifiers, documented relationships, consistent metrics, access rules, and an agreed level of freshness.
Suppose a revenue leader asks how pipeline activity relates to booked revenue. Your customer records and finance records must connect through reliable keys, while terms like qualified pipeline and booked revenue need definitions that both groups accept.
That is why the destination is only one part of the design. When you connect data across sources, you also need business context that tells people what the combined data means and how its parts relate.
Choose the Right Analytics Integration Pattern
The right pattern depends on where you prepare data, where queries run, how current results must be, and which controls apply. You may need several patterns when operational systems, warehouse data, and SaaS sources have different requirements.
| Pattern | Best Fit | Strengths | Watch-Outs |
|---|---|---|---|
| ETL | When you want preparation before loading | Lets you apply rules before data reaches the destination | Plan for upstream logic and maintenance |
| ELT | When you want preparation inside a cloud data platform | Lets you retain source-level data for later modeling | Define controls inside the destination |
| API integration | When you need selected SaaS or operational data | Fits targeted exchanges between systems | Monitor limits, schema changes, and authentication |
| Live or federated access | When governed data already sits in connected platforms | Lets you query data close to its source | Plan for query cost, source load, and performance |
If your analysts need to combine cloud warehouse data with a spreadsheet or third-party source, preparation may happen across more than one stage. A workspace designed to prepare and join data can support that work while keeping the resulting logic visible to the people who maintain it.
ETL, ELT, and APIs Solve Different Problems
For this guide, think of ETL as applying cleaning, standardization, and business rules before data enters its destination. Consider this pattern when the destination should receive prepared data or when you manage controls upstream.
For this guide, think of ELT as loading data first and preparing it within the destination. Consider this pattern when you want to retain source-level data and create models for different analytical needs.
For this guide, think of an API as a defined way to access data or actions from an operational system. You might use one for selected support, billing, or product records alongside repeatable ETL or ELT pipelines.
Batch schedules may be enough for monthly finance analysis, while another question may call for more frequent updates. The right cadence comes from the decision you are supporting, not from a blanket demand for the fastest possible refresh.
Live Queries Keep Analysis Close to Governed Data
Use live access when you want queries to run against data where it is already managed. Check whether the source controls, query cost, source load, and expected response time fit the analytical question.
Use cached or extracted data when an update schedule better fits your performance, cost, or source-load needs. Compare the trade-offs for each workload instead of treating either method as the default.
You can also use both methods within the same program. For example, a frequently used operational view might use cached data, while a finance question stays live against its governed source.
Make Shared Definitions Part of the Integration
Connected tables can still produce conflicting answers when identifiers, joins, and metrics differ. Build shared definitions into your design so every source contributes to a common analytical view instead of creating another place to reconcile numbers.
Start by defining canonical metrics, documenting join paths, standardizing key fields, testing duplicates and nulls, and naming an owner for each shared rule. A governed data model gives those decisions a reusable home, including calculated metrics, synonyms, filters, and access rules.
Public-sector findings offer a bounded example of what can go wrong when data does not line up. The US Government Accountability Office reviewed nine federal eligibility-data sources. Its report on data quality and interoperability found quality issues in all nine and inconsistencies across seven.
Those findings do not describe every government system or private-sector data program. They do show why you should test matching logic and data quality before relying on cross-source results.
Give Analytics Users a Model They Can Understand
Use a semantic model to map source tables to business concepts people recognize. You can define reusable metrics, familiar terms, documented joins, filters, and governed access as part of that model.
Give analysts shared logic they can review instead of asking them to rebuild it. Make each metric traceable to its definition, and document why the model joins two sources.
Your model also creates a clear review point. When a metric changes, the owner can update the shared definition rather than asking every dashboard creator or analyst to revise separate logic.
For example, a pipeline metric may need a defined stage, date field, currency treatment, and owner. Writing those choices into the model gives analysts a common starting point and makes later review more direct.
Build an Analytics Integration That Holds Up in Practice
A broad integration program can grow faster than your ability to govern it. Keep the first release tied to a decision people need to make. Add sources and use cases after the data, definitions, and controls pass practical tests.
Start with the decision. Write down the question, who uses the answer, and what action follows.
Map sources and owners. Record each source, its responsible owner, its update cadence, and its known limits.
Select integration patterns. Choose ETL, ELT, APIs, live access, or a mix based on preparation and query needs.
Standardize definitions and identifiers. Agree on metrics, key fields, grain, join rules, and exception handling.
Establish controls. Set access rules, quality checks, monitoring, and an escalation path for failures.
Release a focused use case. Test one analytical workflow, gather feedback, and monitor the logic before adding scope.
Review siloed ownership, mismatched schemas, manual handoffs, weak quality checks, and unclear access rules as practical risk areas. Test the integrated result against known records, and ask source owners to review exceptions.
When your systems exchange data, document each data-element definition and the expected format, structure, tagging, and transmission. Record who owns those specifications and how your team will review changes before they affect downstream analysis.
Before expanding, test whether joins preserve the expected grain, whether duplicates change totals, and whether null values have agreed handling. You should also verify that access controls still apply after sources are combined and that failed updates are visible to an accountable owner.
Compare the first integrated result with records that source owners already know. When totals differ, document whether the cause is timing, grain, filters, missing keys, or a definition mismatch before anyone uses the result for a decision.
A Simple Integration Readiness Checklist
Use this checklist before you move an integrated use case into regular decision-making:
Defined decision: The question and the action tied to the answer are clear.
Named source owner: Every source has someone responsible for its meaning and availability.
Documented identifier and join: Keys, grain, relationships, and exceptions are recorded.
Agreed metric definition: Each core metric has one approved calculation and owner.
Freshness expectation: Users know how current the data should be and when it updates.
Access control: Permissions apply across the combined data, including restricted fields and rows.
Quality test: Checks cover duplicates, nulls, format mismatches, and expected totals.
Escalation path: Someone owns investigation when a pipeline, source, or result fails a check.
If any item is unclear, narrow the first use case until ownership and controls are manageable. A smaller release with traceable logic gives you a stronger base than a wide integration no one can confidently explain.
Put Integrated Data to Work in Analytics
The payoff from integrated data is the ability to ask cross-source questions with traceable logic. A larger dashboard may display more charts, but value comes from understanding how the records, definitions, and relationships support an answer.
A revenue team can relate pipeline and bookings. An operations team can compare service activity with fulfillment, while an analyst can explore a connected model instead of reconciling exports by hand.
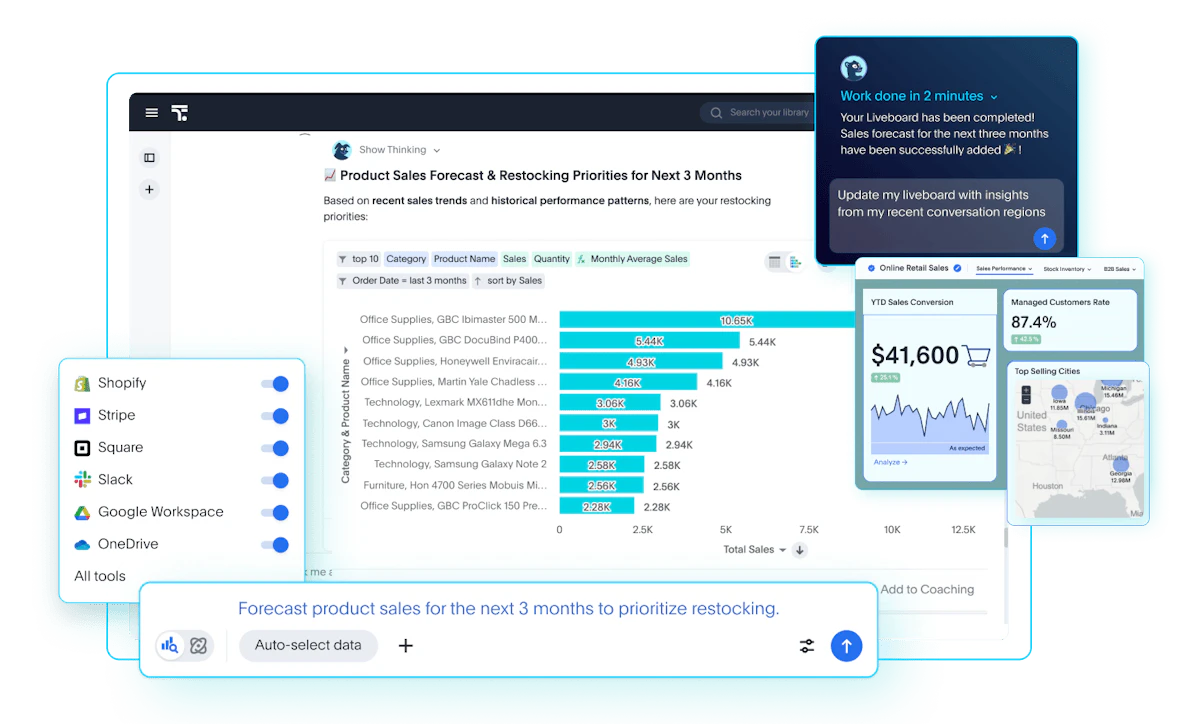
Use the ThoughtSpot connection, preparation, and modeling pages linked earlier to assess how each step fits your stack. Compare their guidance with your source inventory, governance requirements, and first analytical question before you choose an approach.
Once the logic is ready, interactive analytics dashboards can give people a place to examine results and follow related questions. The connection remains useful because the model and controls sit behind the presentation.
Keep the analytical question visible as you design the experience. If a view combines pipeline, bookings, and service activity, show which measures come from each source. Also explain which shared rules connect them.
From Connected Data to Trusted Answers
Start with the questions you need to answer, then match the integration pattern, quality controls, and business definitions to those questions. When every source has an owner and every shared metric has a clear meaning, your integrated data can support analysis people can trace and discuss.
ThoughtSpot Connect, Analyst Studio, and governed models can help you connect, prepare, and interpret data across warehouses, databases, files, and APIs. See how you can explore ThoughtSpot Analytics for governed analysis across your data stack.