

Today we announced ThoughtSpot 3, the world’s first product to combine collaborative intelligence with search-driven analytics. We’ve brought the ease of search together with the intelligence of machine learning to deliver a powerful new analytics solution that anyone can use to answer data questions. ThoughtSpot 3 has over 200 new features, including three game-changers: DataRank, AutoJoins and PopCharts.
DataRank uses the wisdom of the crowd to suggest answers
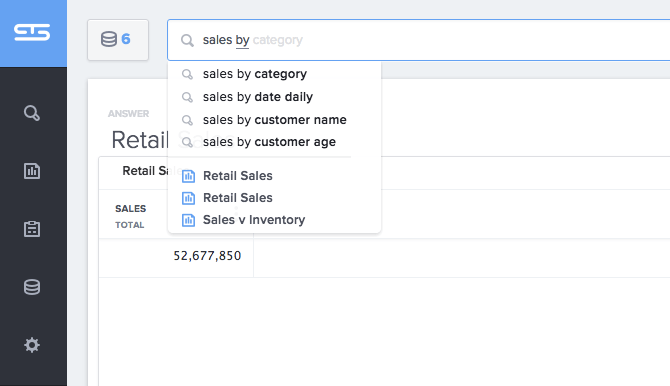
Just as PageRank made Google the fastest and most accurate consumer search engine on the planet, DataRank makes ThoughtSpot the fastest and most accurate relational search engine for data analytics. DataRank leverages machine learning to help users build self service reports and dashboards based on the collective intelligence within their organization. It’s similar to Google’s typeahead experience, where when you type “don”, you get suggested “Donald Trump” because everyone is searching for him right now. With DataRank, when you type “sal”, you’re suggested “sales by customer last week” if that’s what all the users in your company are searching for. As more and more people use ThoughtSpot 3, DataRank learns, and the suggestions become more accurate. The screenshot below shows you an example with ranked suggestions for “sales by” like: “sales by product”, “sales by region”, and “sales by month” - all with the goal of helping business people get to more accurate answers, faster.
DataRank delivers a guided search experience thanks to a machine learning algorithm that takes into account:
The context of the user (Am I in marketing or operations? What’s my security level?)
The collective intelligence of the company (What are other users searching for?)
The characteristics of the data (What are the relationships between my tables?)
The more people search, the smarter and more accurate DataRank gets at predicting what you’re looking for.
PopCharts Automatically Creates Visualizations for You
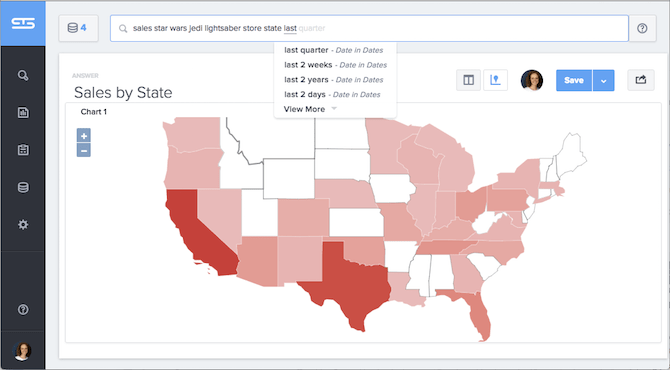
As you type in ThoughtSpot’s search box, answers are calculated and charts are presented instantly. PopCharts chooses from over a dozen new chart types and uses machine learning to present the best one for your search. PopCharts takes out the guesswork and instantly chooses from line charts, bubble charts, geomaps, tree maps, pie charts, and many more. Continuing the example above, if I type “sales by category”, PopCharts presents me with a bar chart, but if I type “sales by state”, PopCharts presents me with a map chart.
AutoJoins Calculates Answers Instantly Across 1000s of Tables
Large enterprises can have hundreds or thousands of data sources. AutoJoins uses ThoughtSpot’s data index, schema index and machine learning to understand how your tables are related and join them on-the-fly to calculate answers across previously siloed databases. So if you want to build a chart looking at sales from your point of sale system, with inventory from your ERP system, it’s as easy as typing “sales and inventory this year”, and AutoJoins will calculate your answer. It also solves for the typical many-to-many and chasm trap scenarios that trip up so many enterprise BI products.
2 Billion Humans Use Search
We built ThoughtSpot, and the new features in ThoughtSpot 3, to bring the ease of consumer search to the world of enterprise analytics. Two billion humans use search every day to instantly access information on sites like Google, Amazon, LinkedIn and Kayak. Search has transformed entire industries by allowing us to bypass “middleman” experts like travel agents, stock brokers, and headhunters so that we can make our own decisions with access to the right information.
Bye-Bye Data Scientist Bottleneck
Until now, search had yet to make significant strides in the world of enterprise analytics. Most employees have been limited to tools that only let us view pre-digested views of our data, put together for us by data experts, such as BI analysts and data scientists. If you’ve been following trends in the data world, then you’ve heard about the lack of these data experts, a shortage that McKinsey estimates to be close to 1.5 million people in the next few years. This gap creates a massive backlog of requests that can stretch for weeks, with the average report taking up to 5 days to build.
How Much Faster? 900x Faster
That’s where ThoughtSpot comes in. ThoughtSpot is a search-driven analytics solution built for the enterprise. Anyone can use ThoughtSpot with zero training to ask questions, analyze company data, and build BI reports and dashboards - all in seconds. An analysis that might take 3 days to build with a legacy BI tool only takes 3 minutes in ThoughtSpot - that’s 900x faster! With the release of ThoughtSpot 3, every business leader now has the power to search to analyze all of their company data, as easily as they use search in their personal lives.


