

CIOs are fed up with having a plethora of BI and analytics tools with business units seemingly chasing the shiniest new solution. And although most industry surveys show data and analytics budgets continuing to grow despite a faltering economy, there is closer scrutiny and belt tightening to rid teams of overlapping capabilities. Here’s a look at how BI tool portfolios have become such a mess and how to streamline them.
Technical debt: the data manager’s ball and chain
Technology debt is a pernicious problem, especially for enterprises. Start ups have the luxury of starting fresh, choosing to build their modern analytics stack fully in the cloud. Even so, the pace of innovation warrants a strategic approach to analytics and BI investments.
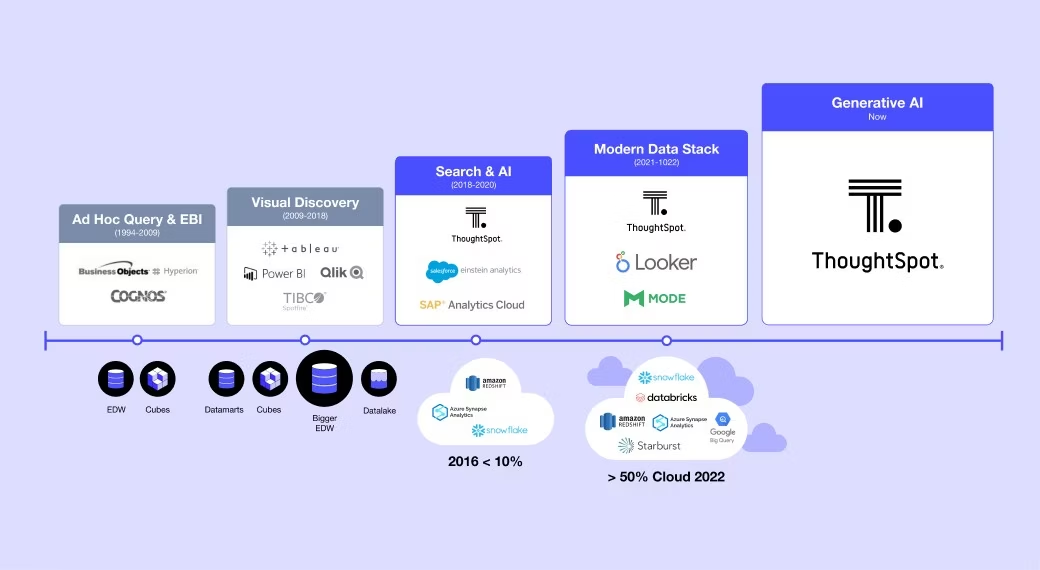
State of the art changes over time and the rate of creative destruction is only accelerating. Who buys analytics tools also changes. What started as on-premises department deployments of Tableau and Qlik purchased by individual users or business units grew to enterprise buying over time. Desktop tools gave way to server-based products, swinging purchasing and admin power back to IT. Server products have given way to cloud, SaaS applications, swinging the purchasing power back to lines of business. Data visualization and dashboard products are being displaced by augmented analytics platforms that empower business users. Integration with cloud ecosystem products such as dbt and Snowflake or Google Big Query were not buying considerations five years ago. Integration with LLMs such as GPT and Bard were not considerations five months ago.
As technology changes, requirements change and companies should absolutely modernize their tech portfolios to leverage such innovations. Think about it: is it more expensive to maintain that clunker of a car or, at some point, invest in a new one? The same applies to analytics and BI software.
The challenge is that as an industry, we are good at bringing in new technology but terrible at decommissioning it.
Most organizations don’t even have visibility into what is being used. Multiple CDOs and analytic leaders have shared with me their fear of turning something off. Others have done just that: shut down 9,000 reports and waited to see who complained. What they often discover is that only a handful of reports were consistently used.
Further, the time horizon of a technology investment strategy has gotten increasingly shorter and innovation faster. What used to be a safe time horizon to set technology standards for five to ten years is now three to five. SaaS analytics platforms lowers switching costs from a deployment perspective, but investment in skills and analytical content continues to make modernizing analytics portfolios a challenge (see First Mark Capital's latest MADD framework). Analysts and engineers who have built up credibility and expertise in tools over years are sometimes loath to start again with another tool.
Mergers and acquisitions further contribute to a company having multiple analytics tools.
4 steps to streamline and modernize your portfolio
1. Focus on the why
Technology modernization for modernization's sake rarely gets business people excited. People are busy and change is challenging. Selling a stakeholder on upgrading to stay current is a hard sell. Instead, frame the modernization on the importance from a business perspective for that department or the company overall. Fear is often a stronger motivator than simply doing better. So modernization benefits may include keeping ahead of competitors or the risk of falling further behind in a winner-take-all digital economy.
Identify WIIFM (what is in it for me). Every individual will have a different motivation. You, as the analytics leader and change agent, must identify each stakeholder’s WIIFM. Consider the following examples of what motivates different roles in your organization.
-
CEO: How modern analytics in the cloud will help fulfill the company’s mission and meet business operating goals.
-
CIO/IT manager: Enabling data at the least cost to serve the organization. Risk averse IT people also may feel that buying from a mega vendor is a way of reducing risk. “Nobody ever got fired from buying from IBM,” was once a mantra, and yet, much of the innovation in the analytics industry is coming from pureplay start ups. I often hear from CIOs that this is why they want Microsoft Power BI to be their BI standard: it is “free” as part of a larger Microsoft contract. However, “free” with high people support costs to develop dead-end dashboards does not provide a competitive advantage.
-
CDO/CDAO: Delighting users and enabling self-service as part of creating a data-driven organization. CDOs are increasingly measured on delivering business value so the degree an analytics platform facilitates that value delivery is what puts lines of business in the buyer’s seat.
-
Data analysts: Having an impact on the business, keeping skills up to date, being viewed as a partner to the business rather than a spreadsheet jockey or dashboard monkey.
-
Business users: Whatever will help optimize business KPIs. Data is only useful here if it’s faster, easier, and more accurate than gut-feel decision-making.
2. Understand your personas
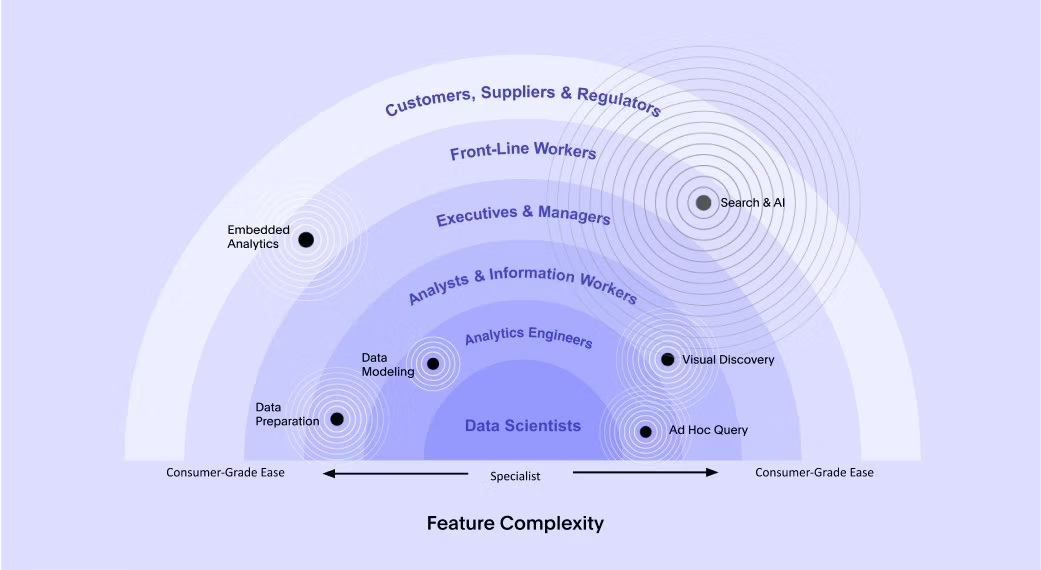
As described in point one, each persona has their own WIIFM and objections. A busy data analyst might be glad to learn a new technology. A busy business person may not be, especially if they are distrustful of data. Different personas in the analytics workflow will have different functionality requirements, and yet, the industry has historically thought of BI users narrowly as two main personas: producer and consumer. This is an oversimplification of personas as every job now has a data component. The degree that people will want to explore, interact, create new content, prepare data, create machine learning models and more varies by role. Just as different personas use different design products such as Adobe Photoshop, Canva, Fliki, and PowerPoint, we need to recognize that data scientists, analytics engineers, data analysts, and business users will have distinct requirements.
Every analytics vendor has its own sweet spot in focusing on a particular persona. That sweet spot also grows over time. While ThoughtSpot, for example, began as focusing mainly on the business user, its capabilities have expanded in recent years to include TML and dbt integration to appeal to the analytics engineer. The degree that a single platform can serve the needs of multiple personas equally well is debatable. A best practice is to create a decision tree that maps the persona with the strengths of each tool in your portfolio.
3. Convert selectively
…or not at all. Many well-meaning BI managers think keeping users happy means converting legacy content to the modern analytics platform. But this is rarely wise, both from a business requirements and state of technology perspective. Recall that it is often unknown how many people rely on those thousands of reports and dashboards. With AI-Powered Analytics, one Liveboard can replace hundreds of reports. In an on premise world, data was often subsetted and aggregated into cubes and extracts for performance reasons in ways that is unnecessary in a cloud world; this subsetting, aggregation, and cube building further contributed to a plethora of dashboards and reports. Not all legacy content should be migrated to a new platform as that content may not be required or it may be more efficient to rebuild.
4. Decommission legacy
BI platforms typically die a slow death within an organization, and stay alive for decades adding complexity and cost to the organization. Because earlier BI tools lacked robust governance and usage reporting of usage, BI leaders have had little visibility into what is actually being used. To proactively decommission non strategic BI tools, follow this approach:
Stop paying maintenance fees on legacy BI tools. On premises software usually incurs an 18 to 25% annual maintenance fee.
Freeze building of new analytic content on legacy BI tools.
Once your strategic analytics platform is up and running and you’ve invested in reskilling, pull the plug on legacy applications.
Incentivize decommissioning: when organizations only celebrate the excitement of bringing in something new and innovative, people will not want to go back and work on pruning the technical debt, even if it yields a cost savings. American Express, for example, actively rewards those who decommission.
The following graphic shows a typical journey of innovating, co-existing, and decommissioning. During the coexistence phase, consider leveraging analytics portals that provide users the ability to access content from a single pane, such as Interworks Curator, Metrics Insights BI Portal, or Zenoptics.
Embrace a modern data experience
There has never been a more exciting time in the analytics and BI space. The maturing of cloud data platforms, GPT, and generative AI will herald in better ways of working, finally democratizing access to data with self-service and low-code tools.
By adopting a modern data experience, Wellthy, a coordinated healthcare company, was able to empower self-service analytics for all users and retire their existing BI platform. You too have the opportunity to embrace this change in a way that maximizes innovation while reducing complexity of your analytics and BI portfolio.
Ready to pay down some of that technical Tableau debt? See how current Tableau customers can get 15% off by switching to ThoughtSpot. Or, you can experience the benefits for AI-powered analytics by signing up for a free trial of ThoughtSpot today.


