

This is part of our ongoing SpotOn Sports: The Data of Cricket series, where leading pundits tackle the toughest questions in cricket by using data & analytics.
As the excitement around the world cup continues to build, Kohli’s star is shining brighter than ever before. Given his outsized impact on India’s success, which I covered in my last blog for SpotOn Sports: The Data of Cricket series, it makes perfect sense.
While the data makes it clear Kohli contributes to India’s chances of winning, I wanted to know what he brings that delivers these outsized results. I used ThoughtSpot’s search again for my answers.
Kohli’s Secret to Success
So how exactly does Kohli do it? It’s deceptively simple: Kohli focuses on converting his starts to 30s and converting those to 100s better than any other batsman. He crosses the 30s in nearly half of his innings, and goes on to convert 48% of those innings either to 100s or remain not out. And his success leads to the team’s success; when Kohli scores 60+, India win 74% of their matches.
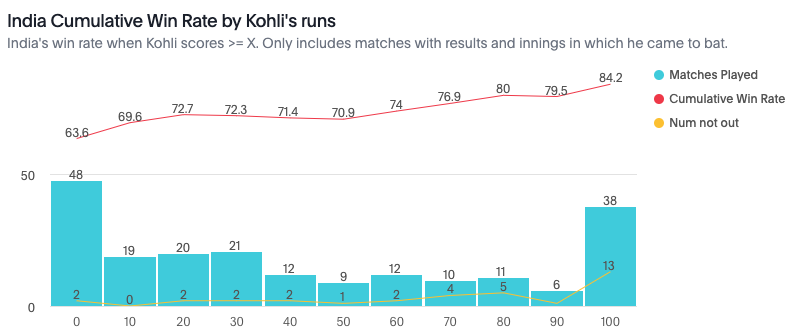
India’s win rate vs runs scored by Kohli in an innings
<br>But how does this compare with other teams with star players? The chart below compares the win rates of the Fab 4. How often does the team win once a player scores more than a given number of runs? Innings score have been divided into ten buckets of 10 runs each except for the last one which includes all 100+ scores.
Team’s win rate vs runs scored by the Fab 4
Team’s win rate vs runs scored by the Fab 4
<br>Only Smith makes a case for being more critical than Kohli. Once he settles in and crosses the 30s, Australia wins 75% of their matches. Note, that India’s win rate may be higher than England, Australia, and New Zealand since the Fab 4 started playing. If you normalize for this, Kohli boosts the chances of winning by up to 20% (64% in run bucket 0-10 vs 84% when scoring 100+) similar to Williamson’s 20% (54% in bucket 0-10 vs 74% when scoring 70+) and Root’s 20% (56% in bucket 0-10 vs 76% when scoring 90+), whereas Smith has a disproportionate effect of 32% (57% in bucket 0-10 vs 89% when scoring 90+).
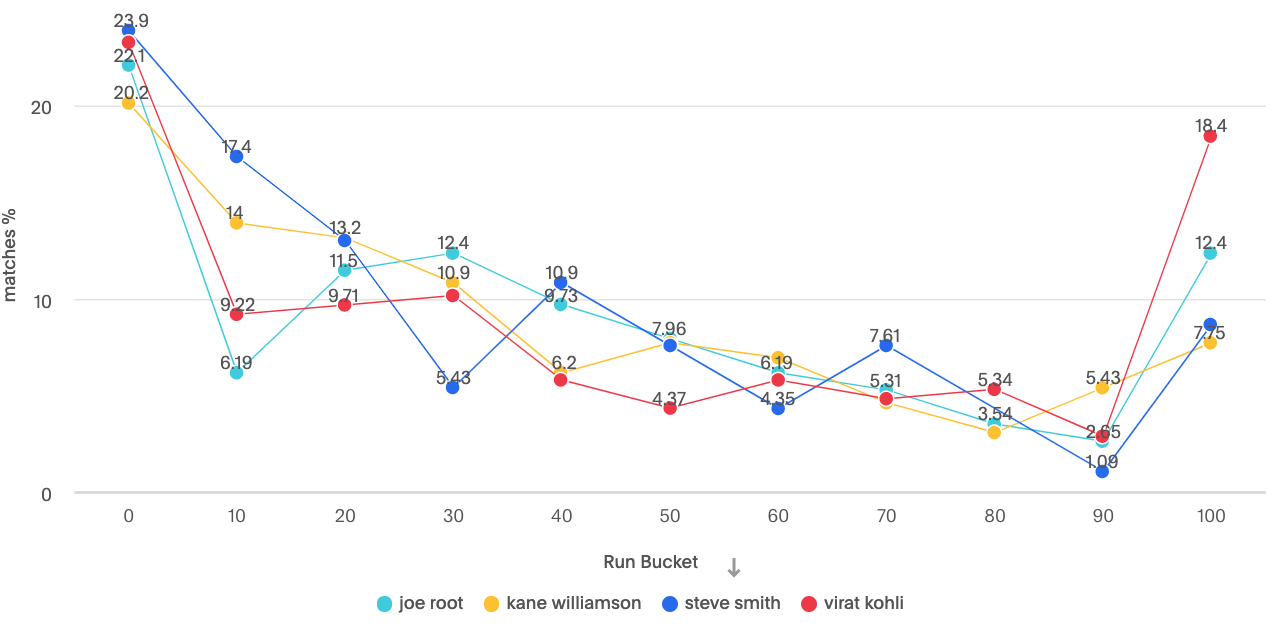
If Kohli scores 60 or more, he has a similar impact on his team’s chances of winning compared to the rest of the Fab 4. The difference? Kohli scores 60+ much more often than them. The below table shows the percentage of innings in which each player has scored within a given range of runs.
Distribution of scores by run bucket (X axis) vs win rate (Y axis) for Fab 4

Distribution of scores by run bucket (X axis) vs win rate (Y axis) for Fab 4
<br>All of them have a comparable distribution of runs except in a couple of buckets. Kohli gets out on a score between 10 and 60 runs in only 40% of his innings, compared to 48% or more for all the others. This enables him to convert his decent knocks (10-60 runs) into big scores (100+) more often than others. He scores a 100 almost every 6th inning he plays, ahead of Root, who takes 8 innings, and way ahead of Smith and Williamson, who both take almost 13 innings.
Bringing it All Together
So how does that all shake out in terms of influencing a team’s success? Look at Kohli’s boost to India’s win rate (20%) in relation to India’s most prolific ODI run scorers in the last 2 decades, and it’s clear he’s miles ahead of both his contemporary Sharma, and all-time legend Sachin, who both boost the chance of winning by 15%.
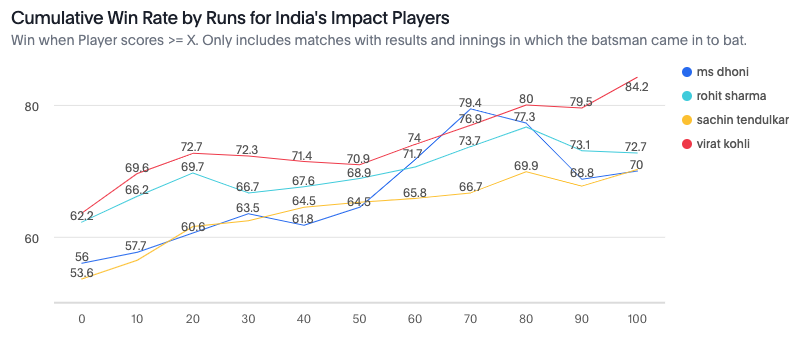
India’s win rate vs runs scored in an innings
<br>Dhoni, however, has had the most impact on India’s winning once he crosses the 50s. He boosts India’s win rate by up to 23% if he scores 70 or more. The win rate, however, dips to 70% as Dhoni inches closer to a century perhaps because that represents the matches in which India’s top order (which scores more than 60% of India’s runs on an average) fails. It leaves Dhoni to negotiate several overs with the lower middle order, which has been weak in the last 4 years, and the tail, which has never been India’s strong suit.
Does that explain why Dhoni has become so much more cautious in his approach at the start of his innings? Or is it explained by the fact that such situations mostly arise when India is batting first and don’t accelerate enough? Since the last world cup, the 1st innings strike rate has increased significantly led by the explosive batting approach of England. Powered by finishers like Kohli and Dhoni, India has chased down almost any total. But that begs more questions, like without a target, does the Indian batting lineup fail to strike at the same rate as other teams?
I’ll be digging into the data to answer these and other burning questions around the world cup in my continuing series on the data of cricket.


