


The world of data is complex. I mean there’s a reason most of us still rely on trained data experts to get answers to simple questions about the business right? We feel your pain. That’s why we built the world’s first Relational Search Engine, designed for any business person to answer their own questions about data using search.
But that’s only one piece of the puzzle. Succeeding with any analytics project takes more than just making the data accessible. Most organizations face real challenges much further upstream in their analytics pipeline with data extraction, data quality, data sprawl, and performance.
Sound intimidating? We’re here to help. This guide serves as an article designed to help you set up an analytics-ready data pipeline using some fundamental dimensional data modeling principles. Whether you’re struggling to keep your data model under control or are looking to understand fundamental dimensional data modeling concepts, this guide is for you.
What is a Dimensional Data Model?
Dimensional data modeling is an analytical approach used in databases and data warehouses for organizing and categorizing facts into dimension tables. This type of modeling enables fast retrieval of information from large datasets by providing a structure that separates out unrelated or inconsequential data from the main body. The dimensional model also helps identify relationships between different types of data, allowing for deeper analysis of trends and patterns.
When it comes to dimensional modeling, fact tables, dimension tables, star schemas, and foreign and primary keys are important to understand.
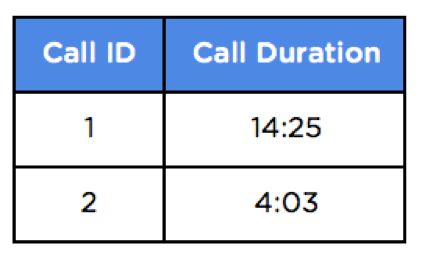
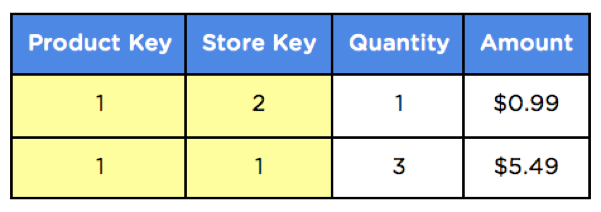
Fact table
Stores the most basic unit of measurement of a business process. Some real world examples include: purchases, phone calls, and orders.
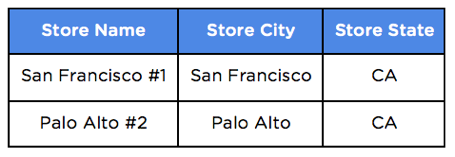
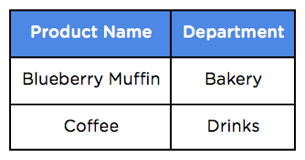
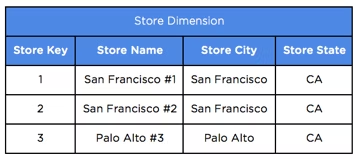
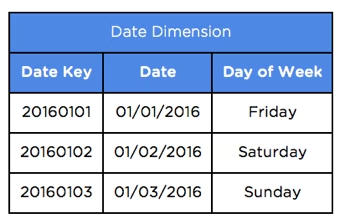
Dimension table
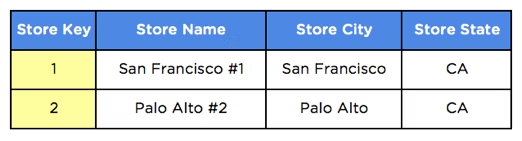
Stores the who, what, when and where of each business process. Details about stores and products would all be found in a dimension table.
Primary key
A column in a dimension table identifying a unique row of data. Primary keys are referenced by foreign keys to join fact and dimension tables.

Now that we have a unique number that can represent each individual product and store, we can include this number in our fact tables as a foreign key.
Foreign key
A column that references another table (hence the name foreign). It’s used to join data from two tables, typically a fact and dimension table.
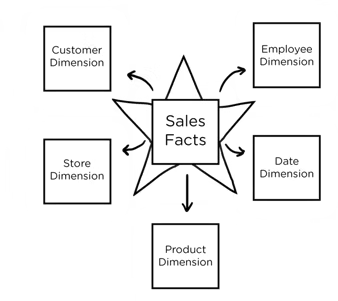
Star schema
A star-like database structure that has foreign-primary key relationships between a fact table and related dimension tables.
Why dimension modeling is Important?
So you’re probably wondering why this is done in the first place. Data models typically start out pretty simple but as businesses evolve and new requirements come up, things can get out of control pretty quickly.
1. Simpler data navigation
People naturally think of processes in terms of the subjects involved, and most questions they have are about relationships between these subjects. How many vanilla chai lattes were sold to customers age 18-25 in December 2015? What were the top 5 stores in California for iced coffee sales last week?
For example, ThoughtSpot let end-users search for whatever they want in a very simple manner. Try it for yourself with our free trial.
2. Faster database performance
Dimensional modeling creates a database schema that is optimized for high performance. This means fewer joins, minimized data redundancy, and operations on numbers instead of text which is almost always a more efficient use of CPU and memory.
3. Flexible to business change
Want to track employees, promotions, or customers? Dimensional models are adaptable to change. It’s as simple as adding a new column and creating a new table.
4 Steps to Create Your Own Data Models
Explaining data modeling is always easier with an example. Let’s use coffee shop sales as the business process and use the following transaction as a simple example. Let’s say Kim, an employee at the Coffee Shop, charges Scott for 1 blueberry muffin, 1 banana, and 1 small black coffee at Palo Alto Store #3 on Thursday, December 1, 2016.
Here’s what this data would look like in a transactional system with just a small subset of details about the purchase.
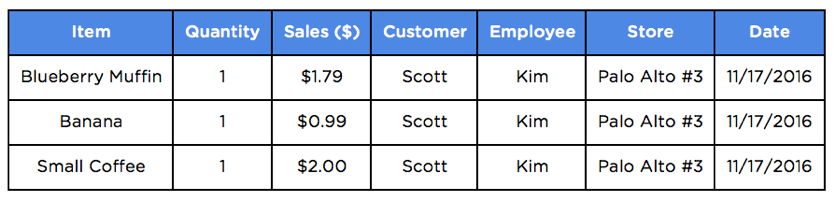
You can probably imagine how this could quickly spiral out of control with billions of transactions, millions of customers, and thousands of stores. Querying transactional data at this scale can create a huge reporting bottleneck with queries that take hours to return or ultimately timeout.
Now that you have some context, here are four tips to help you get started modeling your data:
1. Identify the business process you want to track
In the example above, we’re interested in tracking sales at a coffee shop. But it could be anything that represents an actual business process like customer service phone calls, credit card transactions, or website activity.
2. Choose the granularity of the fact data
This will depend on the total volume of transaction-level data. It’s usually a good idea to start with the finest grain of data and store each sales transaction line item.
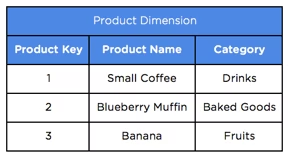
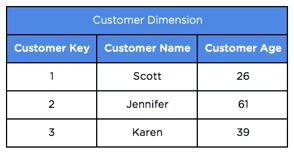
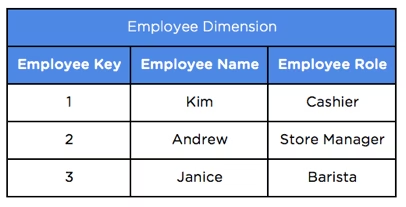
3. Strip out the dimensions
Identify the attributes involved in each transaction and create separate dimension tables for them. Each record in the dimension table should be unique and have a numeric primary key associated to it. In this example stores, products, customers, employees, and dates are all dimensions of the sale.
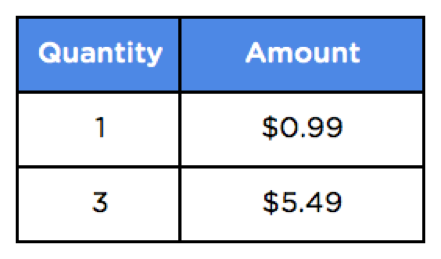
4. Consolidate the facts
The remaining metrics like quantity and sales amount are your measures and belong in a fact table. Alongside each measure, you should have foreign keys that reference all dimensions involved in the process like product, customer, and store.


One of the great things about ThoughtSpot is that it makes this whole process a lot less painful. ThoughtSpot dynamically translates simple searches into complex queries and aggregations that can process billions of rows of data in our MPP In-Memory Cache.
To get the full scoop on how ThoughtSpot simplifies the data modeling process check out our free trial.


