- Whitelabel reporting presents customer-facing reports under your SaaS product’s brand, either inside your product or alongside it.
- Brand styling is only one layer. Customers also need clear workflows, useful context, accessible interactions, and room to explore.
- Evaluate platforms across five areas: brand control, developer fit, tenant authorization, governance, and customer task success.
- Test the full implementation, including identity, allowed and denied data access, accessibility, and representative customer jobs.
- Static reports can mature into governed self-service experiences with filters, drill-downs, search, and conversational analytics.
Your reporting experience can look polished and still frustrate customers. A familiar logo, matching colors, and a custom domain matter. None answers a customer’s next question or verifies who can see each row of data.
Whitelabel reporting works best when you treat it as a product capability rather than a branding task. You are designing how customers find metrics, interpret changes, explore details, and act within the boundaries you set.
What Is Whitelabel Reporting?
Our editorial definition follows. White-label reporting is a customer-facing reporting experience delivered within or alongside a host SaaS product and presented under that product’s brand.
What does your customer see? Depending on the product, the experience may include dashboards, scheduled reports, key performance indicators (KPIs), filters, charts, exports, alerts, or ways to ask follow-up questions. The interface uses your naming, colors, navigation patterns, and customer context.
The audience is external. Your users might be account administrators reviewing usage, operations managers tracking service levels, or clients monitoring campaign performance. Their reporting task happens in the context of the product relationship you own.
Whitelabel reporting may sit directly inside your product, open in a connected portal, or arrive as a branded scheduled output. If you plan to embed analytics into your product, consider the surrounding workflow as carefully as the chart itself.
A branded interface does not prove that the experience is useful, accessible, well governed, or properly isolated between tenants. Those qualities depend on your product design, data model, authorization logic, integration, and testing.
Whitelabel Reporting, Embedded Analytics, and Traditional BI
The category language can get fuzzy. The distinctions below are editorial framing for product decisions, not a formal standard, and the delivery patterns can overlap.
| Dimension | Whitelabel Reporting | Embedded Analytics | Traditional BI |
|---|---|---|---|
| Primary context | Customer-facing reports presented under the host product’s brand | Analytics delivered within another product or workflow | Analytics often accessed through a separate BI environment |
| Brand emphasis | High, because the host-branded experience is central | Varies by implementation and audience | Varies by deployment and intended user |
| Typical user | A customer, client, partner, or tenant user | An internal or external user inside another workflow | Often analysts or business users, though external use is possible |
| Interaction model | Can range from scheduled reports to interactive exploration | Can include dashboards, search, conversations, actions, and custom workflows | Commonly supports dashboards, analysis, reporting, and administration |
| Relationship to host product | Designed to feel connected to the host product | Delivered through the host product or another workflow | May remain separate or connect through embedding and sharing options |
Embedded analytics is the broader delivery pattern. Whitelabel reporting emphasizes the customer-facing, host-branded experience within that broader pattern. The terms are not mutually exclusive.
Traditional business intelligence (BI) can also support customer reporting. The practical question is where your customers complete their work, how much context carries across, and which parts of the experience you control.
As you shape an analytics roadmap for product leaders, decide which customer jobs belong inside your product. A separate environment may fit deep specialist analysis, while common tasks may fit more naturally in the product workflow.
What a Customer-Facing Reporting Experience Needs
Brand treatment is the visible layer: logo, color, typography, domain, terminology, and navigation. Those details help the reporting surface feel connected to your product, yet a credible experience needs more than visual consistency.
Start with information architecture. Group metrics around the jobs customers came to complete, and use their language in labels and filters. If a customer must know your internal data model to find a basic answer, the reporting design is carrying too much friction.
Delivery also shapes the product experience. Validate each dashboard, chart, search path, and follow-up interaction against the customer jobs you defined. A component belongs in the experience when it helps a customer complete a specific task with the right context.
When you compare design approaches, treat interactive analytics experiences as an optional resource rather than proof of fit. Your team should still test navigation, terminology, responsive behavior, state changes, and recovery paths in the complete product workflow.
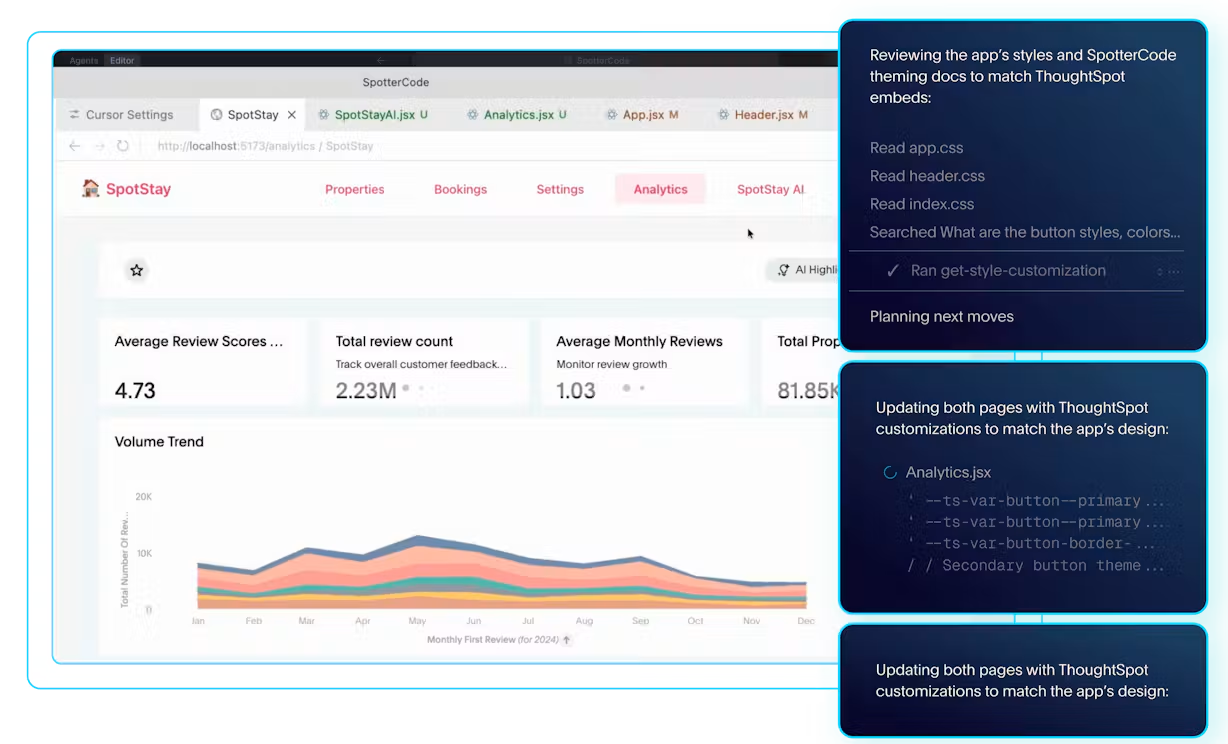
Next, evaluate contextual usability. Can a customer administrator locate a report, apply the right filter, interpret a metric, and return to the surrounding task? NIST’s guidance can help you evaluate reporting usability in context through specified users, goals, effectiveness, efficiency, and satisfaction.
Accessibility needs its own test plan. W3C publishes WCAG 2.2 testable accessibility criteria that product teams can apply to relevant reporting flows. Product-specific testing is still needed across the host product, embedded surface, content, keyboard paths, focus behavior, labels, contrast, and assistive technology.
Finally, give customers a reasonable path beyond the default view. Filters and drill-downs may answer predictable follow-up questions, while search or conversational analysis may support less predictable ones. Your governance model should define which data, actions, and exploration paths each role can use.
How to Evaluate Whitelabel Reporting Platforms
A feature grid can start the conversation, but your evaluation should follow the product experience from design through operation. Use five connected lenses.
Brand control
Check theme variables, typography, chart styling, terminology, custom domains, email templates, loading states, error messages, and vendor-brand removal. Look at the awkward states too, since a polished dashboard can still reveal mismatched dialogs or system messages.
Integration and developer fit
Review software development kits (SDKs), APIs, supported frameworks, authentication patterns, events, custom actions, versioning, testing support, and release practices. Your developers should also examine how the reporting surface communicates with product navigation, customer context, and surrounding workflows.
Tenant isolation and authorization
For multi-tenant products, branding cannot substitute for authorization. OWASP’s current guidance says to verify tenant isolation server-side, rather than trusting a client-supplied tenant identifier as proof of access.
Ask vendors and your own engineers how tenant context is derived, passed, checked, logged, and tested. Your acceptance plan should cover permitted same-tenant requests and denied cross-tenant attempts at the user interface, API, query, export, and scheduled-delivery layers.
Platform controls are only part of the design; they do not make the full customer implementation secure on their own.
Governance and procurement
Document your requirements before the demo cycle shapes the checklist. NIST SP 1305 supports the practice of defining security requirements before evaluating vendors, including how supplier expectations are communicated.
Cover authorization, tenant-isolation evidence, audit needs, data handling, retention and deletion expectations, incident processes, support ownership, accessibility responsibilities, and change management. A completed checklist records expectations; it does not certify a vendor or deployment.
Customer task success
Test representative customers completing representative jobs. Possible measures include task completion, time on task, errors, requests for help, and satisfaction, but treat them as product-specific signals rather than universal benchmarks.
Can users identify the right metric, interpret its scope, and understand its freshness? Can they reach a permitted level of detail without losing their place?
Those answers tell you more than the length of a feature list.
A Practical Implementation Plan
A staged plan keeps product, design, data, engineering, security, and customer-facing teams aligned around the same experience.
Define customer jobs and KPIs
Choose a small set of customer questions and decisions. For each one, document the intended user, metric definition, context, source, freshness expectation, and permitted actions.
Map identity and authorization
Trace how a signed-in user becomes a tenant, role, and policy context. Follow that context across the host product, embedded layer, data source, exports, and schedules. Include denied paths in the design, not only the happy path.
Choose integration points and theme rules
Decide which views belong inside the product and which may open elsewhere. Specify theme tokens, terminology, navigation, responsive behavior, loading states, errors, and support handoffs. If ThoughtSpot is under consideration, include its embedded analytics developer resources as one input to your technical review.
Pilot with acceptance tests
Use a representative user group and realistic data permissions. Illustrative tasks might include locating a report, changing a filter, interpreting a KPI, and drilling into an allowed detail. You can also test authorized sharing and a blocked cross-tenant action.
Instrument feedback and review results
Collect task results, support themes, accessibility findings, authorization-test results, performance observations, and requested follow-up questions. Review the evidence against your acceptance criteria, then revise the experience before expanding its scope.
Moving Beyond Static Reports
Static reports still have a place. A scheduled summary can support a recurring review, and a fixed export may fit a defined handoff. Problems appear when every follow-up question becomes a new report request.
A customer-facing reporting experience can mature in steps. Start with governed metrics and useful filters, then add drill-downs where customers need detail. Offer broader exploration where the data model and authorization rules support it.
Search and conversational analysis can help with follow-up questions that a fixed report did not anticipate. Before adding either interaction, define which metrics are available, how terms map to the data model, and what each role may query.
Keep governance visible as exploration grows. Customers need clear metric definitions, understandable filter scope, appropriate permissions, and cues about data freshness. Your product team also needs ownership for changes to models, roles, content, and customer workflows.
Test each step with realistic customer questions. Check whether users can move from a summary to permitted detail, understand why a result changed, and return to the surrounding task without losing context.
Expansion should follow evidence from your own implementation. Review task results, access tests, support themes, and customer feedback before adding more data or broader exploration paths.
Make Reporting Feel Like Part of Your Product
Credible whitelabel reporting joins brand fit with useful customer workflows, accessibility evaluation, and verified tenant boundaries. It also needs clear governance and room for appropriate exploration. Skip any one of those layers, and the reporting surface can feel disconnected even when the colors match.
Are you deciding how reporting should fit your product? Review ThoughtSpot’s enterprise analytics platform, then compare its capabilities with your customer jobs, technical requirements, and acceptance tests.