


Embedded analytics has become a staple for product teams, and it’s easy to see why. Delivering insights inside your product means no context switching, less friction, and a smoother, more intuitive user experience.
But here’s the kicker: most embedded analytics tools promise flexibility, but the moment you try to scale or customize, you hit a wall.
Suddenly, what’s supposed to feel personalized feels like a clunky add-on.
And that’s exactly why more product teams are turning to headless BI—a modern architecture built for greater control, flexibility, and real-time consistency across every user touchpoint.
Let’s see how it all comes together.
Table of contents:
Headless BI is an architectural framework that introduces a centralized modeling layer and a semantic layer between your data warehouse and the tools that consume data.
By decoupling the two, your dev team gets full creative control. Instead of being boxed into a one-size-fits-all interface, they can now build analytics that feel like a natural extension of your product.
And the best part?
Your data stays consistent across the board. Metrics like ‘revenue’ mean the same thing everywhere, whether someone’s looking at a custom view, a report, or an in-app visualization. There’s no confusion or inconsistency—just one smooth, personalized experience built on a single source of truth.
The term ‘headless’ simply means there’s no built-in presentation layer—aka no front-end.
Here’s the thing: Most embedded analytics tools bundle the backend (where your data and metrics live) with a rigid frontend. This means you’re stuck using whatever UI the tool gives you.
Headless BI breaks this connection. It leaves the UI entirely up to you, so you can design the analytics experience you want—one that feels native to your product and tailored to your users. Plus, you can seamlessly integrate advanced capabilities like embedded AI, natural language search, and real-time exploration.
Let’s break down the core components that make this possible:
Semantic layer: Defines key business terms like revenue or churn so everyone speaks the same data language across dashboards, reports, and apps.
Data modeling layer: Turns raw data into structured formats by setting up relationships, schemas, and dimensions that make analysis meaningful.
APIs and SDKs: Allows you to embed the analytics components you want directly into any app or interface for complete control over the user experience.
Query engine: Converts every click, filter, or drill-down into real-time, optimized queries. This layer helps you make your data experience more interactive.
Data source connectivity: Links your headless BI setup directly to cloud warehouses like Snowflake, BigQuery, or Redshift, so you always work with live, trusted data.
Scalability across the product ecosystem
With headless BI, you define your core metrics—KPIs, business rules, and calculations—once in a centralized layer. That logic then powers analytics across your entire product ecosystem. Think internal tools, customer dashboards, partner portals, all running on the same trusted backend.
Here’s what this approach delivers:
Stronger user trust: With a single source of truth, everyone sees the same real-time data, no matter how and where they interact with your product.
Faster scalability: Even as you add new features, user roles, or products, your analytics foundation stays solid, making scalability much easier.
Less rework for dev teams: When metrics stay consistent, your devs aren’t stuck fixing broken reports; they are more focused on building new innovations.
This architecture scales with you, making it easier to deliver consistent insights across everything you build.
Greater development control
Forget working around rigid layouts and boxed-in features; you control everything, from how analytics looks to how fast it loads. With headless BI, the canvas is yours.
Design every pixel: Customize everything—from chart types and color palettes to filters, fonts, and layouts—using APIs and low-code SDKs to craft an experience that perfectly aligns with your product’s look and feel.
Own the performance: Fine-tune query execution, manage caching, and control exactly when data refreshes to keep everything fast and responsive.
Adapt on your terms: Add new features, workflows, or user roles without breaking your analytics setup.
The result? Embedded analytics doesn’t just look native, it loads quickly and runs smoothly, even with complex data.
Better resiliency for data engineering
In traditional BI setups, even making a small change like renaming a column can be difficult. Dashboards show inconsistencies, numbers disappear, and user trust collapses. Over time, your analytics stack feels fragile and hard to maintain.
Here’s how headless BI helps you build a more resilient analytics foundation:
Simplified system updates: Since the backend is isolated, updates, migrations, or tech stack changes happen without disrupting the user experience.
Smooth multi-product support: If you operate multiple apps, tools, or user portals, you can serve consistent analytics across all of them without duplicating effort.
Better data lineage: Because definitions are centralized, it's easier to trace how a metric like "Net Revenue Retention" is calculated and maintained, making audits, debugging, and updates much simpler.
Instead of patching together fragmented analytics tools, you invest once in a future-proof, scalable architecture that flexes with your business needs.
SaaS products
As your customer base grows, delivering consistent analytics gets harder. With headless BI, you don’t have to rebuild dashboards for every user or worry about messy, inconsistent data. You define your metrics once with a semantic layer and deliver reliable insights to every customer, no matter how quickly your product evolves.
Just look at Act-On as an example. By embedding ThoughtSpot into its flagship SaaS app, it completely revamps its reporting experience with just a few lines of code.
The impact? A 60% jump in usage.
This is what happens when data meets users where they are—insight becomes action.

Internal business tools
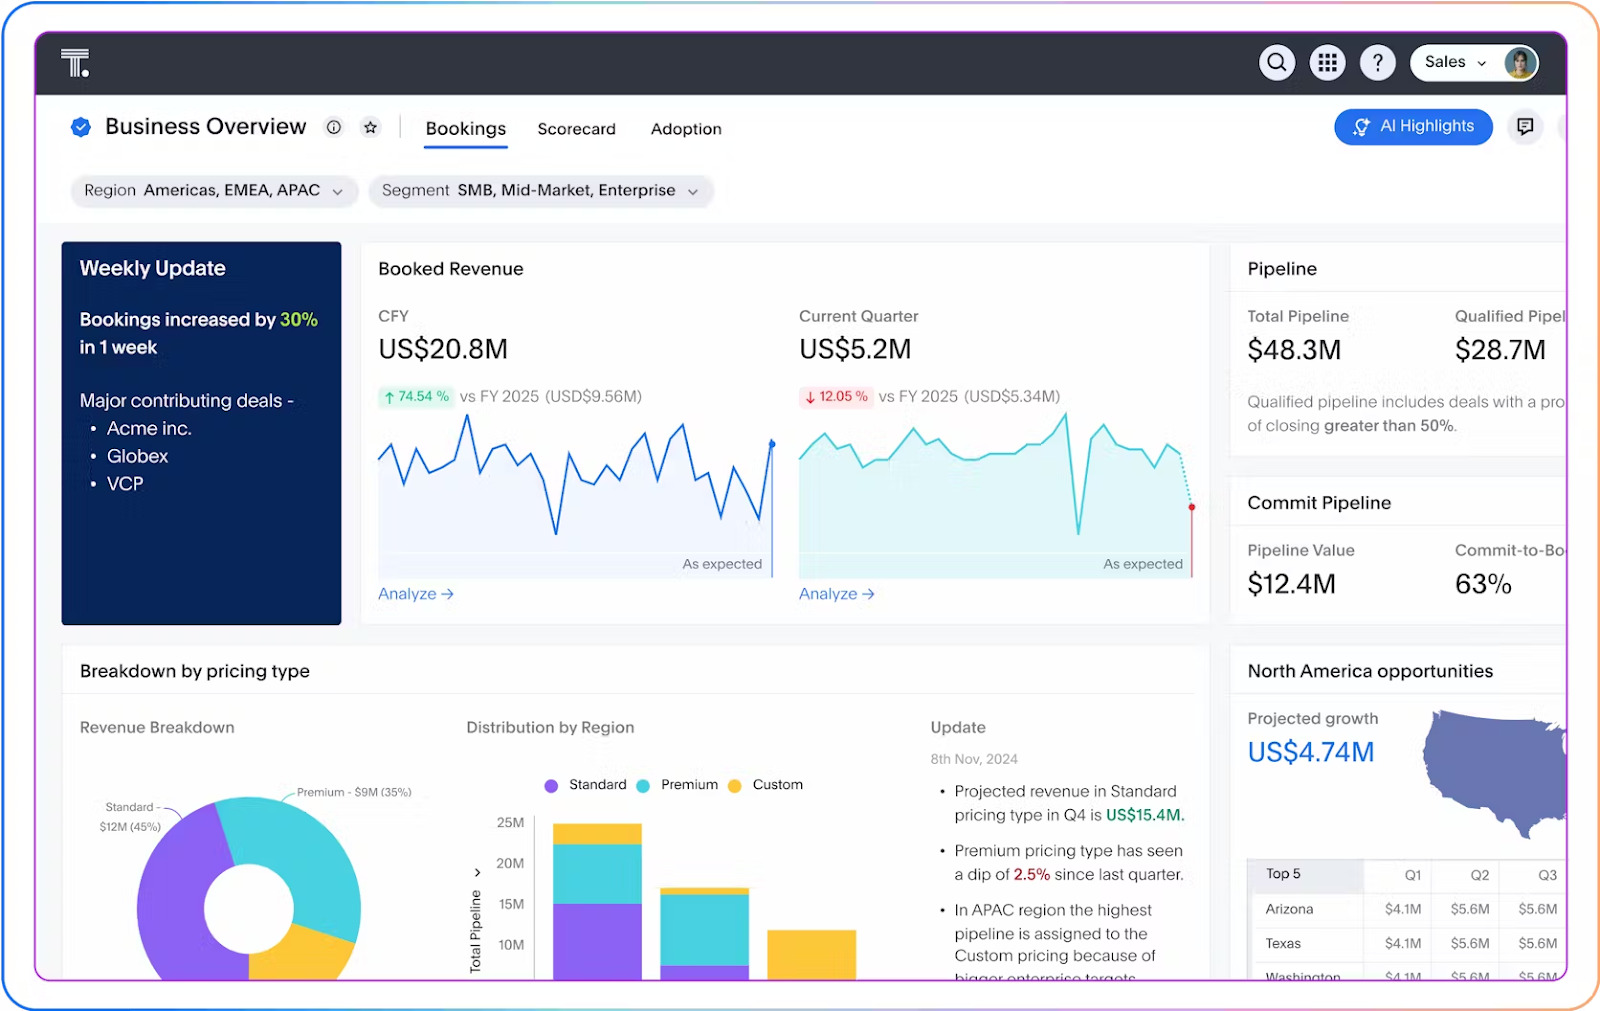
Different teams need different insights. With headless BI, you can deliver exactly what matters most to each one, right inside the tools they already use. Sales sees performance, finance tracks revenue, ops monitors workflows—everyone gets the answers they need, without extra steps.
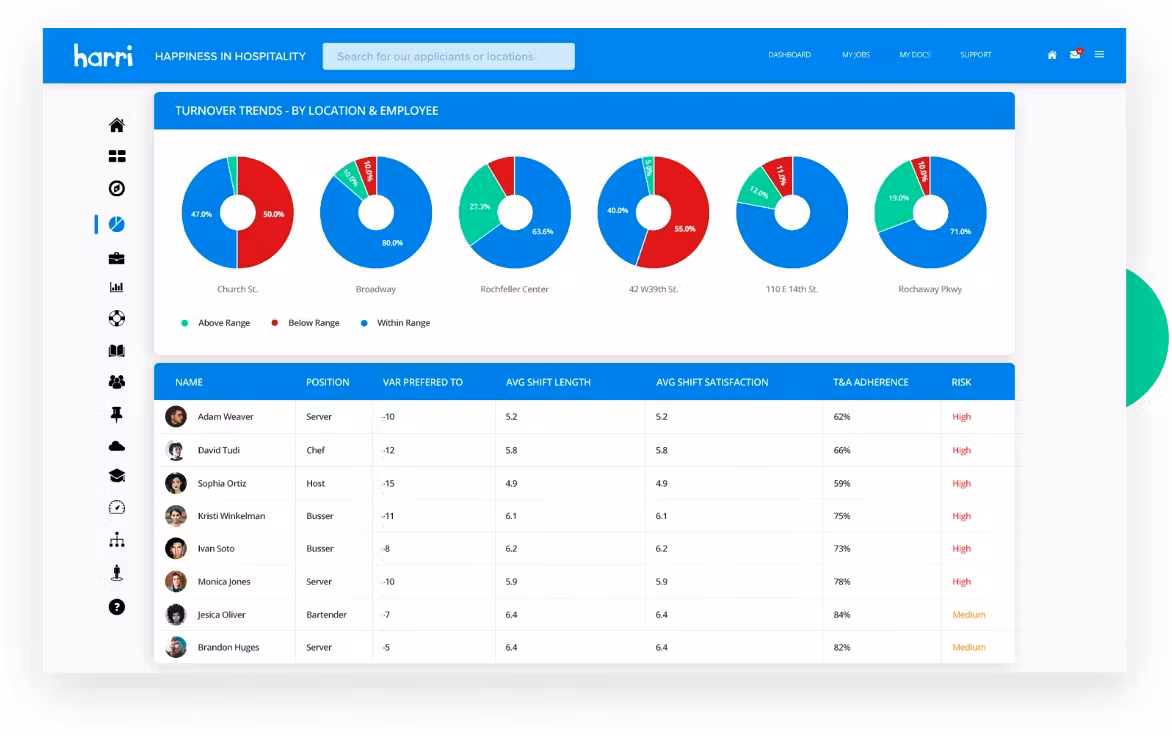
Take Harri, a workforce management platform for the hospitality industry. With ThoughtSpot Embedded’s low-code approach, they gave every user the ability to explore the insights most relevant to their roles.
This is what personalized analytics look like, delivered at the speed of work.
Customer-facing portals
As your customer base grows, the last thing you want is to manage dozens of custom dashboards. With headless BI, you define your metrics once, then dynamically serve personalized insights to each customer—all from a single, secure backend
It’s a simple idea with a big payoff: Build once, personalize for everyone.
The right headless BI platform can drive real impact only if it checks the right boxes. Here’s what to look for:
API-first design: Look for a solution built with developers in mind. It should offer robust APIs and SDKs that let you access data, define metrics, and run queries easily.
A powerful query engine: If you’re powering user-facing portals or apps, speed matters. Look for a headless BI platform that can deliver fast, reliable queries at scale, without lags or bottlenecks.
Granular access control: Data trust starts with security. Make sure the system supports row-level security, role-based permissions, and scalable governance, so you stay in control of exactly who sees what.
Multi-tenancy support: If you’re serving multiple customers or accounts, it should be easy to isolate data, apply personalized branding, and deliver tailored experiences, all while managing everything from a single backend.
No-code embedding options: While APIs provide flexibility, having low-code components or embeddable visual blocks can help you move faster and reduce time to market.
A flexible data modeling layer: Whether it’s defining relationships, creating hierarchies, or evolving your data model as you scale, the right solution should make it easy to keep your analytics organized, scalable, and future-ready.
Let’s face it—stitched-on dashboards kill momentum. They’re slow, rigid, and end up holding your business back. Scaling gets harder, serving customers gets harder, and innovation feels like a constant uphill battle.
By embedding ThoughtSpot inside your product, you don’t just fix these problems—you rewire your entire analytics experience. You move faster and scale without friction. Here’s how:
Low-code SDKs: Build fast, iterate faster. With ThoughtSpot’s Visual Embed SDK, you can embed interactive visualizations, customize workflows, and update data models using just a few lines of code.
Flexible APIs: No more one-size-fits-all dashboards. ThoughtSpot’s APIs let you take full control, from how queries are handled to how insights are styled and delivered. It’s analytics built your way.
Prototype smartly: Build smarter with AI-powered agents that bring true self-service to your users—instant answers, less dev support, and full enterprise-grade governance.
Multi-tenancy ready: One platform, thousands of customers. ThoughtSpot’s live architecture makes it easier for you to serve different segments, accounts, or regions—securely and at scale—without spinning up new environments.
Give your product the analytics edge it needs. Start your free demo today!


