- Treat embedded BI as part of your product experience, with native design, clear user value, and direct paths from insight to action.
- Make governed business meaning, tenant isolation, authorization, and accessibility foundational requirements rather than later additions.
- Give users flexible self-service through search, conversation, drill paths, interactive visuals, and automated signals that guide attention.
- Evaluate delivery methods, developer tooling, operations, and ecosystem fit alongside visible features.
The best embedded BI features help users make decisions without leaving your product. They combine relevant data, trusted definitions, flexible exploration, and useful next steps in one coherent experience.
That standard goes well beyond placing a dashboard inside an iframe. Product leaders need an experience users will adopt, while developers need controls that fit the application architecture and delivery process.
Embedded BI Is a Product Experience, Not a Dashboard Widget
ThoughtSpot presents embedded BI as analytics inside an application, portal, or workflow. Users can review metrics and investigate questions in the product experience.
When comparing standalone BI, ask where users complete analysis and how they retain task context. Would a separate destination or interface interrupt the workflow?
A static embedded report may reduce that context switch, but it can still feel disconnected. Users also need familiar navigation, relevant questions, trusted terminology, and a clear way to act.
Product teams should define the experience around decisions rather than a list of charts. That changes the central question from “What can we embed?” to “What should users accomplish here?”
Start With User Decisions
Begin with the recurring decisions each user role makes. A customer success leader may monitor account risk, while an operations manager may investigate delays or exceptions.
What evidence does each person need before acting? Map that evidence to the product workflow, then decide which metrics, comparisons, filters, explanations, and actions belong on screen.
Context should guide depth. A casual user may need a concise KPI and plain-language explanation, while a power user may need flexible exploration and detailed drill paths.
Make Analytics Feel Native
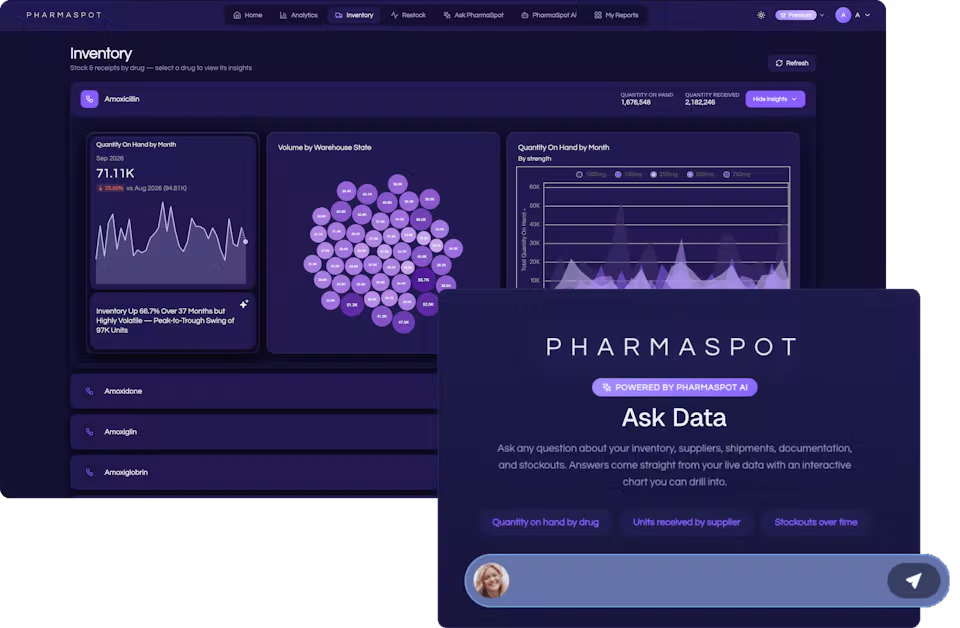
Native design means more than matching a logo color. Layout, typography, terminology, navigation, responsiveness, loading behavior, and empty states should feel consistent with the host product.
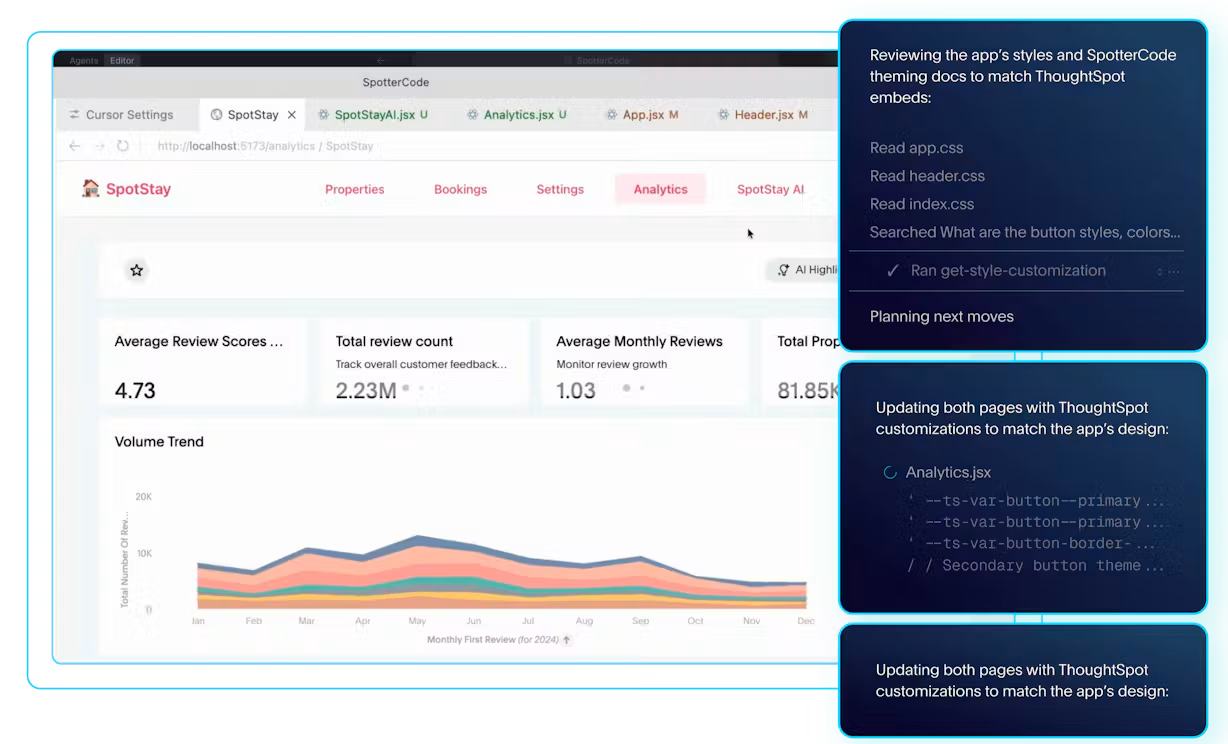
Modular components give product teams more control over that fit. KPIs, interactive charts, search bars, and conversational interfaces can appear where each component supports a specific task.
ThoughtSpot describes analytics for product leaders through customizable modules, a low-code SDK, platform APIs, governance, and multi-tenant architecture. These capabilities support a product-led approach to embedded analytics.
White-label support should cover the full interaction, not only the first screen. Evaluate whether available styling controls align embedded content with established components and design systems.
The Embedded BI Features That Matter Most
A useful feature checklist connects visible capabilities to product and engineering outcomes. Start with experience quality, then examine delivery options, developer control, governance, operations, and action paths.
Flexible Delivery and Composable UI
For an iframe, evaluate authentication, sizing, loading, navigation, event handling, and coordinated state against your product requirements. Test each condition in representative workflows before choosing this route.
For an SDK, review the available components, events, filters, framework support, and application behavior against your intended experience. ThoughtSpot documents its embedded analytics options for teams assessing that fit.
Composable UI matters because users rarely need a full dashboard everywhere. A KPI can summarize status, a chart can explain movement, and a search bar can support an unexpected question.
Ask vendors which pieces can operate independently. Can your team place conversation, visualization, search, and detail views where the user needs them, with shared context across components?
Developer Control and Analytics as Code
Developer experience affects delivery speed, quality, and long-term ownership. Look for clear SDK and API patterns, framework compatibility, event hooks, styling controls, documentation, and predictable release practices.
Versioned content also matters. TML can support version-controlled analytics workflows.
How will analytical content move from development through testing and production? Your evaluation should cover source control, deployment, rollback, environment differences, and ownership between analytics and application teams.
If coding assistance is available, evaluate whether it fits your IDE, application framework, components, and design context. Apply your normal review standards to any suggested code.
Actions, Writebacks, and Workflows
Analysis creates more value when users can respond in context. Custom actions can route a selected insight to another product function, while writebacks can capture approved input or status changes.
Workflows can connect a finding to a practical next step. Examples include opening a case, updating a plan, assigning follow-up, or passing context to another approved system.
The surrounding product should make the action clear. What will change, who can perform it, which data will pass, and how will the user confirm the result?
ThoughtSpot’s Act-On customer story offers a first-party example for teams exploring how embedded analytics can support a customer-facing product experience. Use customer examples to generate evaluation questions, not universal forecasts.
Governance and Security Must Travel With the User
Embedded analytics inherits the trust requirements of both the host product and the data platform. Multi-tenancy, governed models, access controls, publishing, and auditability should work together across the experience.
Define shared measures, dimensions, and relationships before users compare answers across interfaces. Review how those definitions are created, approved, published, and maintained.
Publishing controls help teams manage which content reaches which users and environments. ThoughtSpot documents row-level security and role-based access controls for access boundaries.
Tenant isolation deserves direct testing. The OWASP multi-tenant isolation guidance identifies cross-tenant data leakage as a key risk and recommends transaction-scoped tenant context plus verified isolation.
Use a security and governance checklist during evaluation:
Confirm tenant context is established from a trusted source and applied to every relevant query.
Test data access across roles, groups, tenants, exports, APIs, alerts, and custom actions.
Review how semantic definitions are created, approved, versioned, published, and retired.
Verify that logs support investigation without exposing sensitive data to unauthorized users.
Test failure states, revoked access, expired sessions, and attempts to change client-supplied identifiers.
Carry Authorization Context Consistently
Authorization may depend on more than a role name. User attributes, tenant, requested object, operation, and environmental conditions can all affect the decision.
The NIST attribute-based access control guide defines ABAC through attributes of subjects, objects, operations, and sometimes environmental conditions evaluated against policy. That model illustrates why authorization context must remain consistent.
A user should receive the same permitted answer across a chart, conversational query, export, API request, and action. Otherwise, a secure-looking interface can still contain an inconsistent path.
Ask how the embedded platform receives identity and tenant context. Then inspect how that context flows through sessions, cached results, asynchronous jobs, alerts, and downstream workflows.
Include Accessibility in Acceptance Criteria
Accessibility applies to embedded content as much as the host application. Keyboard use, focus order, labels, contrast, status messages, and understandable interactions should be part of acceptance testing.
W3C published the WCAG 2.2 recommendation on December 12, 2024, and advises using it for future applicability when policies are developed or updated. Product teams can use that guidance to shape evaluation criteria.
Test the combined experience rather than reviewing the host and embedded surfaces separately. Can users move into and out of analytics predictably, understand updates, and operate interactive elements without a pointer?
Self-Service Should Go Beyond Filters
Filters are useful, but they rarely cover every question a user will ask. Strong self-service lets people explore governed data without requiring a new report for each variation.
That experience can combine natural-language questions, drill-anywhere exploration, interactive visualizations, and automated signals. The common foundation is trusted context, so the system interprets business terms consistently.
ThoughtSpot documents row-level and role-based security for its AI agents. Evaluate how those controls apply when conversational analysis reaches governed business data.
An interactive dashboard experience can complement conversation through Liveboards and drill-anywhere exploration. Users may move between scanning, questioning, and deeper investigation.
Let Users Ask Follow-Up Questions
Natural-language search lowers the barrier between a business question and an analytical starting point. Users can ask in familiar terms rather than translating every question into a predefined filter path.
The first answer is only part of the experience. Can users ask a follow-up, change a grouping, compare a period, inspect a driver, or move from a summary to supporting detail?
ThoughtSpot presents Spotter conversational analysis inside the product experience. Evaluate how governed context, feedback, and refinement work for your users.
Surface Changes Worth Investigating
Users cannot inspect every metric continuously. Automated outlier and trend detection can direct attention toward changes that may deserve investigation.
ThoughtSpot lists AI Highlights, Change Analysis, anomaly detection, alerts, and forecasting as visualization capabilities. Evaluate how each one guides attention and supports investigation.
These features should guide attention rather than present every change as important. Give users enough context to judge relevance, inspect supporting data, and decide what to do next.
Evaluate how findings are ranked and explained. Can users see the metric, comparison, period, filters, and analytical context behind an automated narrative?
Use a Feature Scorecard Before You Commit
A feature scorecard turns a broad vendor comparison into a product decision. Weight criteria according to user needs, engineering capacity, risk, and the experience your company wants to own.
Use a simple scale, but require evidence for each score:
| Evaluation Area | What to Test | Decision Question |
|---|---|---|
| Native experience | Components, themes, navigation, responsive behavior | Does analytics feel like part of our product? |
| Self-service | Search, conversation, drill paths, automated insights | Can target users answer real follow-up questions? |
| Governance | Semantic models, publishing, lineage, feedback | Will users receive consistent business meaning? |
| Security | Tenant isolation, roles, rows, sessions, exports, actions | Do controls hold across every access path? |
| Developer fit | SDKs, APIs, events, frameworks, source control | Can our team build and maintain the intended experience? |
| Operations | Environments, monitoring, releases, rollback, support | Can we run this reliably as the product grows? |
| Action paths | Custom actions, writebacks, workflows | Can users move from insight to an approved next step? |
| Ecosystem fit | Data sources, cloud architecture, identity, DevOps | Does the platform fit our existing environment? |
Review how each option will fit your data ecosystem, including data platforms, cloud services, and partner technologies. Architecture fit can affect both initial delivery and ongoing operations.
The Accern embedded analytics story can provide another first-party reference during evaluation. Pair any customer story with your own proof of concept and representative workloads.
Compare Build and Buy Honestly
Building gives your team direct control over the interface and roadmap. It also assigns responsibility for analytical interaction, semantic modeling, security, accessibility, performance, observability, and future feature demand.
Buying can provide established capabilities and reusable components. Your team still needs to integrate the platform, shape the experience, govern content, and operate it within product standards.
Which capabilities truly differentiate your product? Separate those from table-stakes work that will consume engineering time without creating a distinct customer experience.
Consider the full time horizon rather than the first release. Maintenance, browser changes, model updates, security testing, support, and user requests continue after launch.
The choice may also be mixed. Teams can buy an analytics foundation while building differentiated workflows, domain language, actions, and interface patterns around it.
Test the Experience, Not Only the Demo
A polished demo shows a preferred path. A useful proof of concept tests your data, users, architecture, design system, permissions, and operational constraints.
Build scenarios around representative tenants and roles. Include realistic data volume, concurrency, themes, filters, follow-up questions, exports, actions, and edge cases.
Product leaders should assess usefulness, coherence, and adoption barriers. Developers should assess integration control, code quality, events, debugging, documentation, and upgrade behavior.
Security teams should test isolation and authorization boundaries. Operations teams should review monitoring, deployment, failure handling, support paths, and environment management.
Ask every vendor to demonstrate a difficult workflow, not only a standard dashboard. What happens when a user changes roles, loses access, asks an ambiguous question, or triggers an action that fails?
Document the evidence behind each score. That record will make tradeoffs visible and reduce the influence of a single impressive feature.
Choose Features That Make Analytics Part of the Product
The right embedded BI features connect user decisions, trusted meaning, native design, developer practices, and approved action paths. A static dashboard can cover only a small part of that job.
Start with the product experience you want users to have. Then test whether the platform supports it across tenants, roles, devices, workflows, and release cycles.