- Operational dashboards support recurring, time-sensitive decisions by showing current performance, exceptions, and the next action.
- Data freshness should match the decision window. Live data is useful only when the team can act at the same speed.
- Alerts need context, severity, a named owner, and a response path. Otherwise, they become noise.
- A focused set of operational KPIs is more useful than a crowded catalog of metrics.
- Dashboard governance keeps definitions, access, ownership, and review practices dependable as business needs change.
An operational dashboard is a focused view of current performance that helps your team spot exceptions and act within its operating cadence. It brings measures, targets, status, and context together so people can quickly see what needs attention.
A useful operations dashboard is part of a decision loop, not a passive display. This guide explains its purpose, how it differs from other dashboard types, what to include, which KPIs to choose, and how to govern it.
What Is an Operational Dashboard?
An operational dashboard presents the current state of a business process, team, or service. Its job is to help people make frequent, near-term decisions using a shared view of performance.
The dashboard usually combines a small set of operational KPIs with targets, status indicators, trends, and exceptions. A support leader might track queue volume and response risk, while an operations manager might watch throughput, delays, and capacity.
The U.S. Environmental Protection Agency describes dashboards in a monitoring context as supporting data access, visualization, and alert management for decision-making in its dashboard monitoring guidance. That connection between monitoring and action is central to operational dashboard design.
An operational dashboard differs from a static report because it supports an active operating rhythm. Your team may review it throughout the day, during shift changes, or in a weekly service meeting.
“Real time” does not always mean instant. A warehouse response may depend on data updated every few minutes, while a staffing review may work well with daily data.
The right dashboard refresh rate depends on when a decision becomes necessary and how quickly the team can respond. Faster data adds little value when no one can act before the next scheduled review.
The Decisions an Operational Dashboard Should Support
Start with the questions your team must answer repeatedly. What changed, is performance within tolerance, where is attention needed, who owns the response, and what should happen next?
Each metric should help answer at least one of those questions. If a chart does not affect a decision, escalation, or follow-up, it may belong in a deeper analytical view.
Think of the dashboard as one part of a decision loop:
A measure changes or crosses a threshold.
The dashboard brings that condition to the right person’s attention.
The person reviews context and supporting detail.
The owner takes an agreed action.
The team checks whether performance returns to the expected range.
This framing keeps the dashboard centered on operational decisions. It also makes requirements easier to test because every element has a clear purpose.
Operational vs. Analytical and Strategic Dashboards
Operational, analytical, and strategic dashboards answer different questions. Your organization may need all three, but each should have a distinct job and audience.
| Dashboard Type | Time Horizon | Refresh Cadence | Primary User | Core Question | Level of Detail | Typical Action |
|---|---|---|---|---|---|---|
| Operational | Current day to near term | Live, near real time, hourly, or daily | Frontline leaders, managers, and operators | What needs attention now? | Focused metrics with exception detail | Assign work, resolve an issue, or adjust capacity |
| Analytical | Historical to forward-looking | Based on the analysis need | Analysts, managers, and data teams | Why did this happen, and what patterns matter? | Detailed exploration across dimensions | Investigate causes, compare segments, or test a hypothesis |
| Strategic | Monthly to multi-year | Weekly, monthly, or quarterly | Executives and business leaders | Are we progressing toward major goals? | High-level outcomes and trends | Adjust priorities, investment, or long-range plans |
Operational dashboards favor speed, clarity, and exception handling. Analytical dashboards favor exploration, comparison, and context, while strategic dashboards favor goal progress and longer-term direction.
The boundaries can connect without disappearing. For example, an operational alert may lead to an analytical investigation, which may later inform a strategic change.
ThoughtSpot supports governed operational analytics with live querying, AI Highlights, and governed self-service.
When to Use Each Dashboard Type
Choose the dashboard type by looking at decision frequency, urgency, audience, and required depth. A service queue needs an operational view, root-cause analysis needs an analytical view, and quarterly goal tracking needs a strategic view.
A common mistake is combining every time horizon and audience into one dashboard. The result often has too many metrics for operators and too little depth for analysts.
Instead, give each view a clear purpose and connect them through drill paths or related content. Users can start with the operational signal and move into detail when the situation calls for it.
Design an Operational Dashboard for Fresh Data, Exception Monitoring, Ownership, and Access
A strong operational dashboard combines four design elements: appropriate data freshness, actionable exceptions, clear ownership, and accessible presentation. Together, they help people move from a signal to a response without searching through separate reports.
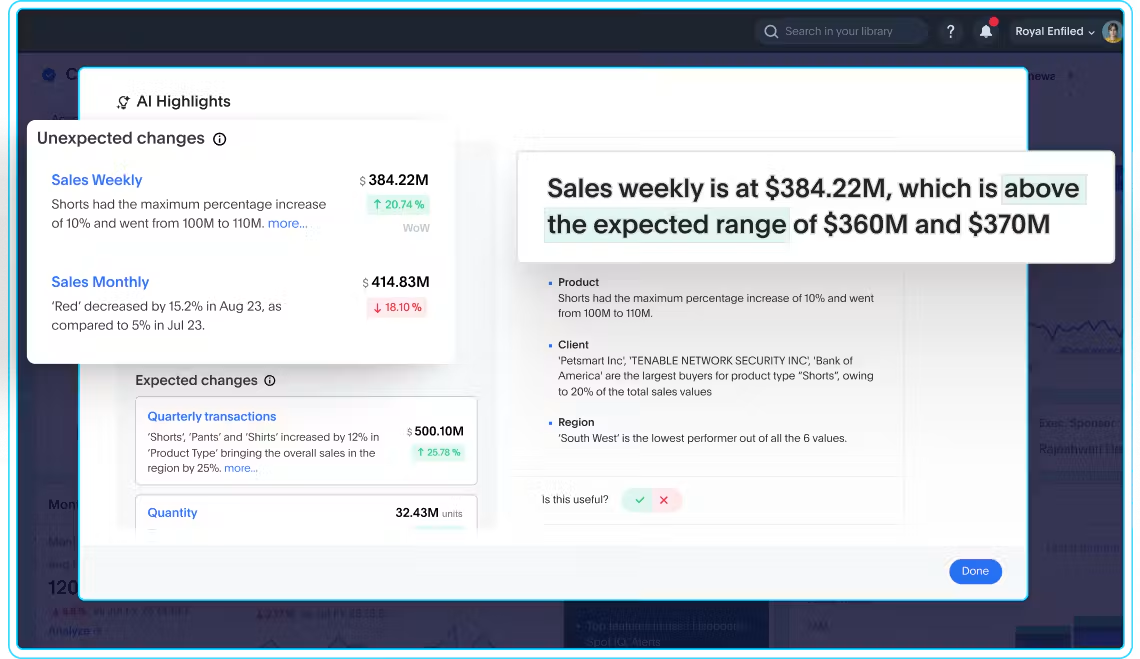
The image above illustrates how expected and unexpected changes can be presented with explanatory context. Its sample figures, labels, and percentages are illustrative rather than evidence of business results.
Good design begins with the operating process, not the chart library. You need to know when decisions happen, which conditions matter, who responds, and how users reach supporting detail.
The Oregon Health Authority’s accessible dashboard design guidance recommends descriptive titles and captions, plus direct labels or shape and shading alongside color. It also recommends at least 4.5:1 contrast for standard text, 3:1 for large text, and 3:1 for non-text visuals.
Match Data Freshness to the Decision Window
Set the dashboard refresh rate from the action deadline. If a team must respond within 15 minutes, yesterday’s data is too old, but a monthly planning metric does not need constant updates.
Start by mapping four times: source availability, data processing, dashboard refresh, and expected response. The combined timeline tells you whether the dashboard is fresh enough for the decision.
Live queries and cached datasets are both valid design choices. ThoughtSpot supports live and cached data options, which let teams weigh freshness needs against performance considerations.
Show users when the data last refreshed and what period each metric covers. Also define what they should do when a source is delayed, missing, or outside its expected update window.
A “real-time dashboard” label can create false confidence when the underlying source updates less often. Clear timestamps and source notes give users a more accurate view of what they are seeing.
Surface Exceptions With a Clear Next Action
An operational dashboard should draw attention to material movement, not make users inspect every number. Thresholds, variance, and alerts can help surface conditions that merit review.
Every exception needs context. Show the current value, expected range, direction, severity, affected segment, and the time period behind the signal.
Then connect the signal to a response. Name the owner, response window, escalation path, and next step, such as investigating a segment or assigning follow-up work.
Limit alerts to conditions that merit action. Too many low-value notifications can make important warnings easier to miss and weaken trust in the dashboard.
Assign Metric and Response Ownership
Metric ownership and response ownership are related, but they are not the same. The metric owner maintains the definition, formula, source, and quality checks.
The response owner acts when a measure crosses a threshold or moves outside its expected range. That person may be an operations manager, service lead, inventory planner, or another role close to the process.
Display ownership where users can find it quickly. Include escalation paths, review cadence, and definition notes so a user knows whom to contact and what action is expected.
Ownership also needs a backup plan. Role changes, leave, and reorganizations should not leave a critical alert without a responsible person.
Make the Dashboard Accessible and Easy to Scan
Design the first view for rapid comprehension. Use descriptive titles, direct labels, readable type, logical reading order, and a limited number of visual priorities.
Do not rely on color alone to communicate status. Pair color with text, shapes, icons, or patterns so users can interpret a warning without guessing.
W3C’s WCAG 2.2 contrast requirements set a 4.5:1 minimum contrast ratio for standard text and images of text at Level AA. The criterion includes stated exceptions for large text. Contrast is one part of access, alongside keyboard use, clear focus order, and meaningful labels.
Keep the initial view focused, then provide progressive detail. Filters and drill-down paths can help users move from a result into the dimensions behind it.
Choose Operational KPIs That Lead to Action
Choose operational KPIs by starting with the operating objective, decision, and response. Available data may shape the implementation, but it should not define the dashboard’s purpose.
A useful KPI signals progress, risk, or a condition your team can influence. It also has a clear target or tolerance, a defined owner, and an agreed response.
Use this checklist before adding a KPI:
Decision relevance: What recurring decision does this KPI support?
Clear definition: Can every user interpret the measure the same way?
Controllability: Can the team influence the result within its operating scope?
Target or tolerance: What range counts as expected, warning, or critical?
Ownership: Who maintains the metric, and who responds to movement?
Refresh cadence: Is the data current enough for the decision window?
Indicator role: Is it a leading signal, a lagging outcome, or supporting context?
Response: What action follows when performance moves outside the expected range?
Balance the KPI set across outcomes, flow, quality, capacity, and risk. A fulfillment team, for example, might pair on-time completion with backlog, defect rate, available capacity, and aging exceptions.
Keep the primary view small enough to scan. Diagnostic measures can sit behind filters, drill paths, or secondary views instead of competing with the KPIs that direct action.
Avoid vanity metrics that appear positive but do not guide a decision. Total activity may look impressive, yet it can hide delays, quality problems, or work that does not support the operating goal.
Use a KPI Definition Card
A KPI definition card gives every user the same reference point. It also gives data and business owners a practical format for reviewing changes.
Include these fields:
KPI name: A clear, specific label.
Business question: The decision or condition the KPI supports.
Formula: The calculation and treatment of exclusions.
Source: The system and governed data model behind the measure.
Grain: The level at which the measure is calculated.
Target: The expected result or range.
Warning threshold: The point that calls for review.
Critical threshold: The point that calls for immediate action.
Owner: The metric owner and response owner.
Refresh cadence: The expected data update schedule.
Expected response: The action or escalation tied to movement.
Governed definitions reduce debates during operating reviews. The team can spend more time responding to performance and less time reconciling competing versions of the metric.
Operational Dashboard Examples Across Teams
Operational dashboard examples are most useful when they show the decisions behind the metrics. The table below keeps each example focused on KPIs, exceptions, and ownership.
| Team | Decisions | Example KPIs | Actionable Exceptions | Likely Owners |
|---|---|---|---|---|
| IT service operations | Prioritize incidents, manage commitments, and balance work | Backlog, priority incidents, resolution time, commit progress, work mix | Service risk, aging incidents, missed commitment, sudden volume change | Service lead, incident manager, IT operations manager |
| Supply chain and inventory | Replenish stock, expedite orders, and address supplier issues | Stockouts, fill rate, order cycle time, late shipments, inventory aging | Low stock, delayed shipment, aging inventory, supplier variance | Inventory planner, logistics lead, procurement owner |
| Customer support | Allocate staffing, manage queues, and protect service levels | Incoming volume, backlog, first response time, resolution time, reopen rate | Queue spike, service-level risk, rising reopen rate, staffing gap | Support manager, queue lead, workforce planner |
| Revenue and sales operations | Focus pipeline reviews, address forecast gaps, and follow up on risk | Pipeline coverage, conversion, bookings pace, forecast variance, renewal risk | Stalled opportunity, pace gap, renewal risk, regional variance | Sales operations lead, revenue leader, account owner |
Adapt these measures to your process and decision cadence. A KPI that matters in one team may be only supporting context in another.
IT Service Operations
An IT operations dashboard can support a Monday service review and daily incident management. Core measures may include commitments, backlog, priority incidents, resolution time, and work mix.
The dashboard should flag aging incidents, service risk, and sudden changes in incoming volume. Owners can then assign follow-up, adjust capacity, or review the affected service in more detail.
Supply Chain and Inventory Operations
A supply chain dashboard can track stockouts, fill rate, order cycle time, late shipments, inventory aging, and supplier exceptions. The goal is to identify where flow or availability is at risk.
Alerts should connect to a practical response, such as replenishing stock, expediting an order, or contacting a supplier. Segments like location, item, carrier, and supplier can provide useful context.
Customer Support Operations
A customer support dashboard can combine incoming volume, backlog, first response time, resolution time, reopen rate, and service-level risk. These measures help leaders balance demand with staffing and queue priorities.
When a measure moves, users should be able to inspect channel, segment, issue type, and staffing context. That detail helps distinguish a broad demand spike from a concentrated process problem.
Revenue and Sales Operations
A revenue operations dashboard can focus daily or weekly reviews on pipeline coverage, conversion, bookings pace, forecast variance, renewal risk, and stalled opportunities. The operating question is where action could improve the current period’s execution.
Use exceptions to direct attention to accounts, regions, products, or stages that need review. Keep long-range executive scorekeeping in a strategic view rather than crowding the operational dashboard.
Build and Govern an Operational Dashboard in Seven Steps
A practical build process connects dashboard design with dashboard governance from the start. Definitions, permissions, quality checks, change control, usage review, and retirement are part of the product, not administrative work added later.
Use these seven steps:
Define the operating decision. Write down the recurring decision, its frequency, its deadline, and the action that follows.
Identify users and owners. Name the audience, metric owners, response owners, and escalation roles.
Select KPIs and thresholds. Choose the smallest useful set, then define targets, warning levels, and critical conditions.
Map sources and freshness. Document source systems, processing time, refresh cadence, latency, and data-quality checks.
Design the exception-first view. Put current status and material exceptions first, with detail available through filters or drill paths.
Test real operating scenarios. Use actual decisions, threshold breaches, stale data, and access conditions to assess the experience.
Publish and review. Apply access controls, document definitions, track changes, review usage, and retire views that no longer serve the process.
Governed data models, enterprise controls, and self-service exploration can support the shared definitions and investigation paths behind an operational dashboard.
Operational dashboards are easier to sustain when business users can answer routine questions without waiting for a new report each time.
Validate the Dashboard With Operating Scenarios
Test the dashboard with scenarios that reflect real work. Include a threshold breach, stale data, a missing source, an access restriction, an ownership change, and a conflicting metric definition.
For each scenario, ask four questions:
Can the user identify the issue quickly?
Can the user understand its business context?
Can the user reach the detail needed to investigate?
Can the user take the correct next step without requesting a separate report?
Testing should include the people who make and carry out the decisions. Their feedback can reveal unclear labels, missing context, weak thresholds, or response steps that do not fit the operating process.
Set a Governance and Review Cadence
Review the dashboard monthly or quarterly, based on how quickly the process changes. Check KPI relevance, thresholds, data quality, ownership, access, usage, and open issues.
Keep a change log for metric definitions, formulas, thresholds, and source updates. Use an approval path that includes the business owner and the data owner when a change affects shared reporting.
Watch for duplicate and unused views. Retiring them helps teams maintain one dependable operating reference instead of choosing among conflicting dashboards.
Governance should also cover role changes and access reviews. A current owner list and appropriate permissions keep the dashboard aligned with how the team works today.
Turn Operational Data Into Daily Action
An operational dashboard works when fresh enough data, focused KPIs, actionable exceptions, named owners, accessible design, and governance operate as one system. If any part is missing, people may see the numbers without knowing what to do next.
Start with the decision, then build the view, alerts, ownership, and review process around it. If you want to see how ThoughtSpot supports interactive dashboards, automated insights, alerts, and deeper analysis, explore interactive Liveboards.