


Data remains the lifeblood of strategic decision-making, and the pace of innovation in analytics and business intelligence (BI) continues to accelerate. As vendors adapt to new AI capabilities and shifting enterprise demands, the competitive landscape is evolving in subtle but important ways.
The 2025 Gartner® Magic Quadrant™ for Analytics and BI Platforms delivers an updated, rigorous assessment of the market, highlighting trends in execution, vision, and technology adoption. This article is your practical guide to the latest quadrant: it breaks down key vendor movements from 2024 to 2025, explores what these shifts mean for buyers, and helps you make sense of the changing BI landscape.
Table of contents:
- What is the Gartner Magic Quadrant?
- How does the Magic Quadrant work?
- How to use this report as a data leader?
- Comparison with the 2024 report: Leaders Quadrant vendors
- Vendor placement comparison: 2024 vs 2025
- What makes ThoughtSpot a leader among other vendors in the market
- What’s changing in the Analytics and BI space in 2025?
The Magic Quadrant is a research methodology used by Gartner that visually positions vendors in a specific market segment based on two key dimensions:
Ability to Execute (how well a vendor delivers today)
Completeness of Vision (how well it understands and shapes the market’s future)
Vendors fall into one of four quadrants:
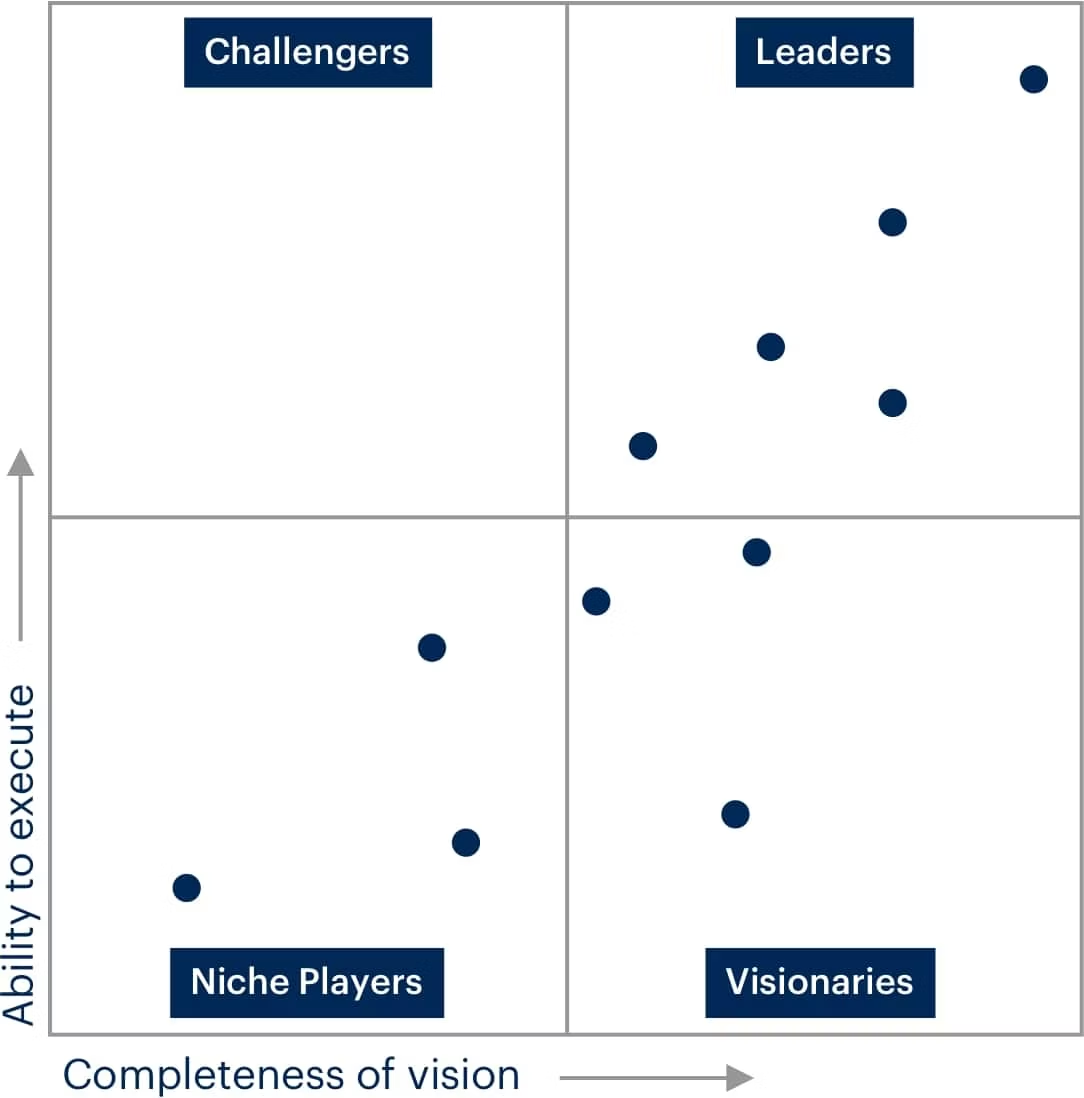
1. Leaders: Strong execution and vision. Broad appeal, trusted by enterprises for scale and innovation.
2. Challengers: Excellent execution but a narrower vision or focus.
3. Visionaries: Compelling innovation and vision, but potential execution gaps.
4. Niche Players: Great for specific use cases or verticals, but limited breadth or scale.
It’s not just a ranking, it’s a strategic tool that helps you understand where vendors stand and how they’re likely to evolve.
Gartner’s Magic Quadrant is the result of a rigorous, structured research process that evaluates vendors in a specific market. Here's how it typically works:
Market analysis
Gartner analysts begin by studying the overall market landscape. This includes identifying key trends, evolving customer needs, competitive pressures, and emerging technologies. The goal is to understand what matters most to buyers and how the market is changing.
Vendor evaluation
Gartner then engages directly with vendors, collecting extensive data through questionnaires, briefings, customer references, and other research. They examine product features, innovation roadmaps, pricing models, sales and marketing strategies, customer support, and overall customer satisfaction.
Scoring and positioning
Using their proprietary methodology, analysts score vendors on two axes: Ability to Execute and Completeness of Vision. These scores determine where vendors land in the four quadrants: Leaders, Challengers, Visionaries, and Niche Players.
Publication
Finally, Gartner publishes the Magic Quadrant report. This includes the famous quadrant graphic showing vendor placement, as well as an in-depth written analysis of each vendor’s strengths, cautions, and market context.
This thorough process is designed to go beyond marketing promises and sales pitches. It reflects real-world customer outcomes, product capabilities, and strategic alignment with industry trends, making it a trusted resource for technology buyers making high-stakes decisions.
The Magic Quadrant isn’t meant to tell you what to buy; it’s there to help you make smarter, more strategic decisions. Here’s how you can use it effectively:
Evaluate vendors carefully: Assess potential providers for data-related technologies or services. Look beyond the “Leaders” quadrant to see which vendors best fit your needs, whether that's broad capability or specialized innovation.
Benchmark your current partners: Compare your existing technology providers against those in the Magic Quadrant. Identify strengths, gaps, and opportunities to improve.
Inform your strategic planning: Bring Gartner’s insights into your planning sessions. Use the trends, emerging technologies, and best practices highlighted in the report to guide your roadmap.
Mitigate risk: Reduce the risk of poor vendor choices by understanding their position in the quadrant, strengths, and cautions. Make sure any vendor you choose truly aligns with your organization's needs.
Explore partnerships: Consider building relationships with well-positioned vendors to access advanced technologies, expand capabilities, and support innovation.
Here’s how the Leaders in Gartner’s Magic Quadrant evolved from 2024 to 2025, highlighting their focus areas, GenAI progress, and market strengths.
Google (Looker)
2024
Positioned as a Leader for its multicloud architecture and strong governance features.
Introduced Looker Conversational Analytics for natural language interactions.
Integrated Looker Studio for enhanced self-service analytics, free or Pro versions with semantic modeling.
Improved visualization options and responsive mobile experiences.
2025
Strengthened agentic analytics with Gemini in Looker, providing conversational AI for multistep reasoning.
Expanded open semantic layer capabilities for deeper integration with other BI platforms and custom apps.
Enhanced embedded analytics with responsive canvas and a unified mobile app.
Continued to emphasize API-first design for composable analytics across ecosystems.
ThoughtSpot
2024
Embraced GenAI to simplify data interaction through conversational interfaces.
Enhanced real-time collaboration and data storytelling features, making insights more actionable and accessible to non-technical users.
Strengthened its market position with low-code and no-code capabilities, empowering a broader range of users to build analytics workflows.
2025
Introduced Spotter for agentic, multistep conversational analytics that integrate with business apps and productivity tools.
Launched Analyst Studio, giving data teams a unified space for AI prep, cost management, and driving strategic impact.
Expanded embedded analytics through Smart Apps, letting users take actions and trigger workflows directly within other applications.
Improved low-code integration options, making it easier for organizations to customize and embed AI-driven analytics into existing systems.
Sustained strong market momentum with a focus on GenAI-powered decision automation for enterprise analytics teams.
Microsoft (Power BI)
2024
Maintained dominant market presence through integration with Microsoft Fabric.
Leveraged Copilot to deliver natural language insights and automate metric calculations.
Benefited from broad adoption and easy internal training due to familiarity with the Microsoft stack.
Integrated D&A stack including OneLake, Data Warehouse, and Spark.
2025
Launched CoreAI Platform and Tools for enhanced AI-driven analytics experiences.
Improved Copilot features with richer context, reasoning, and proactive recommendations.
Continued integration with Fabric for seamless data movement and advanced governance.
Addressed workload isolation concerns with new Surge Protection features to balance capacity usage.
Oracle (Oracle Analytics Cloud)
2024
Emphasized strong integration with Oracle business apps and Fusion Data Intelligence.
Introduced the Analytics AI Assistant for natural language querying and dashboard assembly.
Focused on advanced data preparation with semantic profiling and ML-based pattern detection.
Delivered strong vertical solutions, especially in healthcare and life sciences.
2025
Expanded bring-your-own-LLM support to leverage third-party models like OpenAI.
Enhanced AI Assistant for multistep, agentic analytics tasks.
Improved Auto Insights for proactive, automated data storytelling.
Deepened integration with Oracle’s broader ecosystem for better embedded workflows.
Qlik
2024
Recognized for its associative engine, enabling free-form data exploration.
Offered SaaS-based Qlik Cloud Analytics with Sense, Predict, and Automate.
Focused on strong governance, cloud-agnostic deployment, and application integration.
Invested in conversational analytics and AutoML features.
2025
Launched new agentic AI framework for multistep, conversational analysis.
Introduced Qlik Answers for unstructured data insights and real-time decision-making.
Acquired Upsolver for no-code streaming and simplified data wrangling.
Emphasized modular, composable architectures to fit diverse enterprise needs.
Salesforce (Tableau)
2024
Excelled in visual-based data exploration with strong user community support.
Offered automated insights via Einstein Discovery and collaborative tools like Tableau Pulse.
Focused on deployment flexibility across major CSPs (Azure, AWS, Google).
Strengthened integration with the Salesforce ecosystem.
2025
Launched Tableau Next with an open lakehouse architecture unifying structured, unstructured, and streaming data.
Introduced agentic analytics with an AI semantic layer for contextual understanding.
Enhanced embedded visualizations in workflows and connected insights to actions with an integrated workflow engine.
Continued investment in predictive analytics and industry-focused solutions.
Microsoft: Continued as a Leader
Qlik: Continued as a Leader
Tableau (Salesforce): Continued as a Leader
Google: Continued as a Leader
Oracle: Continued as a Leader
ThoughtSpot: Continued as a Leader
Alibaba Cloud: Continued as a Challenger
Amazon Web Services: Continued as a Challenger
Domo: Continued as a Challenger
MicroStrategy: Moved from Challenger (2024) to Visionary (2025)
SAP: Continued as a Visionary
SAS: Continued as a Visionary
Tellius: Continued as a Visionary
Pyramid Analytics: Continued as a Visionary
IBM: Continued as a Visionary
Zoho: Continued as a Niche Player
Sisense: Continued as a Niche Player
Incorta: Continued as a Niche Player
GoodData: Continued as a Niche Player
Sigma: New entrant as a Niche Player
Spotfire (TIBCO): Dropped as it did not meet all the inclusion criteria
ThoughtSpot’s placement as a Leader in the Gartner Magic Quadrant reflects our focus on delivering analytics that are accessible, scalable, and effective for organizations of all sizes. We aim to balance a user-friendly experience with advanced capabilities, so teams across the business can find and act on insights.
Here’s what sets ThoughtSpot apart in a crowded field of over 20 ABI vendors:
Natural language–driven experience
We focus on delivering self-service insights through natural language conversation. With Spotter, our agentic analytics feature, you can perform multistep conversational analyses and get contextual, nuanced answers using predictive text, synonyms, and chatbot integration. This approach lowers the barrier for non-technical teams to get meaningful value from data.
Automated insights with SpotIQ
ThoughtSpot doesn’t just answer questions, it proactively finds them. SpotIQ automatically scans dashboards for anomalies, highlights them visually, and guides you through key driver analysis. This reduces the manual work required to discover critical trends and outliers.
Embedded analytics with Smart Apps
With Smart Apps, you can embed AI-powered analytics directly into your own business applications. This lets you take action, write back to systems, or trigger workflows without leaving your existing tools. It also offers a low-code platform and developer playground for easy customization and integration.
Analyst Studio for data teams
We know technical teams need advanced tools too. Analyst Studio gives you a unified space to prepare data for AI and analytics, manage cloud costs, and maintain governance. It balances ease of use for business users with robust support for advanced analytics work.
Strong market momentum
Gartner notes a significant increase in search and inquiry volumes for ThoughtSpot, reflecting growing interest in this approach. This momentum comes from organizations like yours looking to adopt GenAI-powered, natural language interfaces that make data accessible to more people across the business.
Scalable, enterprise-grade architecture
ThoughtSpot is designed to handle large datasets and complex analyses without sacrificing usability. Our architecture ensures organizations can scale self-service analytics without creating silos or bottlenecks.
Ultimately, our leadership position reflects our focus on bridging the gap between ease of use and advanced analytics. By delivering a consumer-grade experience, automated insights, embedded analytics, and agentic AI features, we aim to help you drive data adoption, speed up decision-making, and get more value from your data investments.
You can access the full Gartner Magic Quadrant report here, or read our analysis of the report on our blog.
The rise of Generative AI
In 2024, Generative AI went from concept to core feature for ABI platforms. Vendors focused on delivering conversational interfaces, natural language query (NLQ), and natural language generation (NLG). This shift turned dashboards into dialogues, enabling users to ask questions in plain language and receive AI-generated insights instantly.
GenAI was positioned as the new standard for making analytics accessible to non-technical users.
In 2025, GenAI has matured into agentic analytics. Instead of simply responding to questions, AI agents can perform multi-step analyses, automate report creation, and proactively surface insights. Vendors are investing in AI assistants that learn organizational terminology and workflows, offering tailored, context-aware recommendations.
The focus has shifted from just “ease of use” to true decision automation.
Embedded and composable analytics
In 2024, ABI vendors recognized the growing demand for embedding analytics into business applications. Many introduced SDKs and APIs to let companies integrate dashboards and visualizations directly into their products and workflows.
Composable architectures began to gain traction, with organizations seeking flexible solutions tailored to their needs.
In 2025, this trend has accelerated. Vendors now offer headless BI options, semantic layers, and robust API access to deliver analytics without pre-built UIs. ABI platforms are no longer monolithic apps but modular components that can be snapped into broader data ecosystems.
The goal is to deliver insights everywhere users need them, without forcing them into a standalone BI tool.
Governance and interoperability
In 2024, there was a rising emphasis on data governance, with vendors adding usage tracking, role-based access, and data lineage features. Interoperability also became a selling point, as customers wanted ABI platforms that could connect to multiple cloud environments and avoid vendor lock-in.
In 2025, governance has become table stakes. Vendors are now differentiating on governed AI, ensuring AI-driven insights comply with security, privacy, and compliance standards. Interoperability is evolving beyond connectors to truly unified data ecosystems, with semantic layers that ensure consistency of business definitions across tools, clouds, and teams.
Low-code and No-code democratization
In 2024, ABI platforms expanded low-code/no-code capabilities, empowering “citizen analysts” to design dashboards, automate workflows, and conduct analyses without needing advanced technical skills. This democratization was framed as a way to broaden data literacy.
In 2025, low-code has moved beyond dashboards. Vendors now enable users to compose agentic workflows. automated sequences where AI agents handle data prep, analysis, and reporting. The result is a push toward self-service decision automation, with business users orchestrating complex analytics processes using simple, intuitive interfaces.
Vendor ecosystems and lock-in concerns
In 2024, customers were wary of hyperscalers (like Microsoft, Google, AWS) due to the risk of vendor lock-in. ABI vendors countered this by touting independence, open integrations, and support for hybrid/multicloud deployments.
In 2025, the tension remains, but vendors have responded. Independent ABI providers emphasize cloud-neutral architectures and partnerships with multiple data warehouses, ETL tools, and ML platforms. Meanwhile, large cloud vendors are introducing more transparent pricing and governance options to alleviate lock-in fears while deepening integration within their own ecosystems.
From dashboards to decisions
In 2024, the industry was transitioning from delivering static dashboards to enabling real-time, contextual insights. Vendors invested in storytelling capabilities, collaborative features, and richer visualizations to help users interpret and act on data.
In 2025, the focus has shifted even further, from insights to decisions. ABI platforms are embedding recommendations, scenario planning, and even prescriptive analytics into their workflows. AI agents don’t just highlight trends; they suggest next steps, helping organizations move from descriptive to truly decision-centric analytics.


