


Most missed opportunities start with siloed customer data. Transactions live in one system, support tickets in another, and web behavior in a third. When it takes three days to answer a simple question about customer behavior, or when teams can’t even agree on churn rate, you’re already behind. The result is that your competitors with unified data are acting while you’re still analyzing.
Customer analytics fixes that by giving every team a single, trustworthy view of your customers so they can make faster, more confident decisions.
In this guide, you'll learn the six types of customer analytics, the four analytical lenses for viewing your data, and how to choose the right platform to turn customer insights into action.
What is customer analytics?
Customer analytics is the process of collecting and analyzing customer data to understand behavior, preferences, and patterns to inform your business decisions.
It helps you move from guessing what your customers want to knowing exactly how they interact with your brand, when they're likely to churn, what drives loyalty, and how to keep them engaged.
Think of it as your roadmap for turning raw customer data into strategies that boost retention, increase lifetime value, and personalize every experience.
As Jacques van Niekerk from Wunderman Thompson Data puts it, treating your first-party customer data seriously is like making sure your team has oxygen; without it, you'll slowly suffocate without even realizing the danger.
The four analytical lenses for customer data analytics
When you analyze customer data, you’re really asking four types of questions — what happened, why it happened, what might happen next, and what to do about it. Traditional BI tools often stop at the first step, while modern customer analytics platforms let you move seamlessly through all four lenses.
1. Descriptive analytics
Descriptive analytics answers "What happened?" by summarizing historical customer behavior through reports and dashboards. You might see that 15% of your customers churned last quarter or that your average order value increased by 8%.
2. Diagnostic analytics
Diagnostic analytics digs deeper to answer "Why did it happen?" Instead of just knowing that churn increased, you can explore which customer segments were most affected and what triggered their departure.
With modern AI agents like Spotter, you can ask follow-up questions like "Why did churn spike in the enterprise segment?" and get instant, contextual answers.
3. Predictive analytics
Predictive analytics looks ahead to answer "What will happen next?" Using machine learning models and AI analytics, you can identify which customers are at risk of churning in the next 30 days or predict which prospects are most likely to convert.
4. Prescriptive analytics
The most advanced lens answers, "What should we do about it?" Based on your predictive insights, prescriptive analytics recommends specific actions, like offering a targeted discount to a high-risk customer or suggesting the optimal time to reach out to a warm lead.
Start Getting Better Insights
Six practical types of customer analytics you can deploy now
Every stage of your customer journey tells a story, from acquisition to renewal. These six types of customer analytics help you read those stories and act on them.
1. Customer segmentation analytics
Customer segmentation groups customers based on shared characteristics, behaviors, or value to help you tailor your approach for each segment. Instead of treating everyone the same, segmentation reveals which groups drive the most revenue, which need different messaging, and where you should focus retention efforts.
When you know what your high-value segments have in common, you can mirror those traits in acquisition and create more personalized experiences.
Questions answered: Who are your most valuable customer groups? What characteristics do loyal customers share?
Key data sources: Transaction history, demographic data, engagement metrics
Core metrics: Customer Lifetime Value (CLV), purchase frequency, segment size
2. Customer Acquisition Analytics
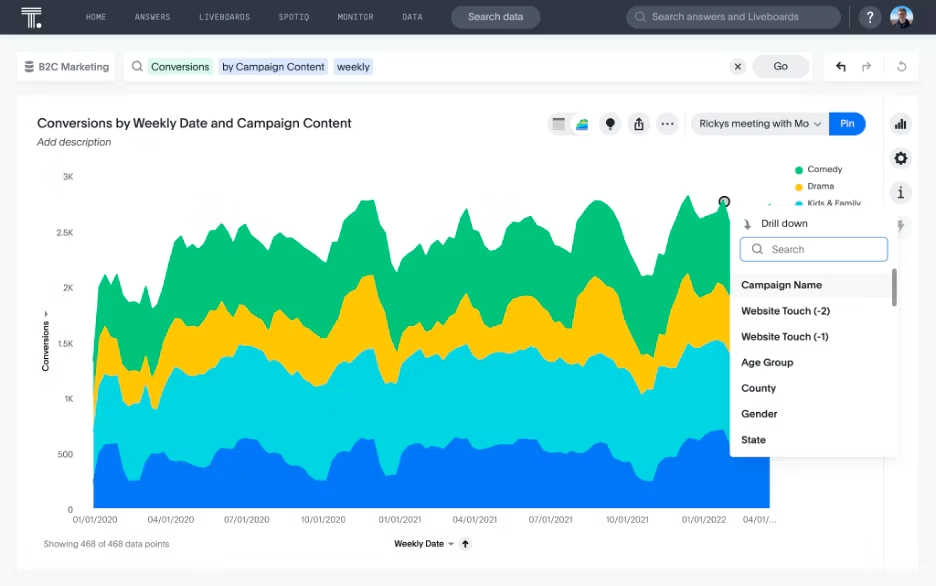
Acquisition analytics shows you which campaigns and channels deliver the most desirable leads by tracking where your new customers come from and how much it costs to acquire them across different channels. A Liveboard can track CAC in real time, letting you shift budget from underperforming social media ads to high-converting search campaigns while the campaign is still running.
Northmill saw this firsthand: Overwhelmed by legacy BI bottlenecks, the neobank adopted self-service analytics with ThoughtSpot's search-driven platform, and customer conversion rates soared 30%.
Questions answered: Which marketing channels drive the most valuable customers? What's your cost per acquisition by campaign?
Key data sources: Marketing attribution data, conversion tracking, campaign performance
Core metrics: Customer Acquisition Cost (CAC), conversion rates, channel ROI
3. Customer Engagement Analytics
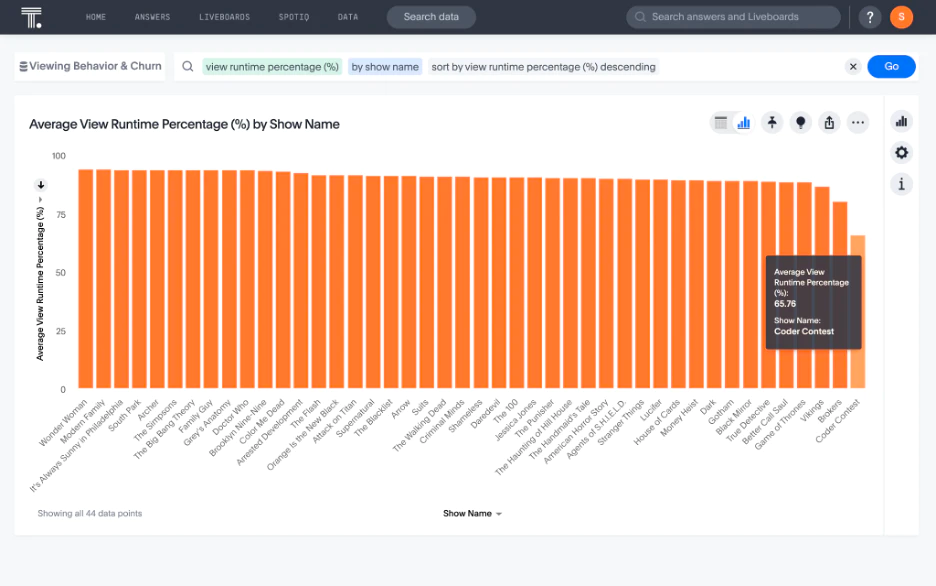
Engagement analytics measures how, when, and where customers interact with your brand to identify patterns that predict satisfaction and retention—the foundation of a strong user engagement strategy. Instead of guessing what resonates, you track engagement and spot declining activity before it becomes churn. Then, you can double down on high-value experiences while eliminating friction points that push customers away.
Questions answered: Which features drive the highest engagement? At what point do users typically drop off?
Key data sources: Product usage data, website analytics, email engagement
Core metrics: Daily/ Monthly Active Users (DAU/MAU), feature adoption rates, session duration
4. Customer Satisfaction Analytics
Satisfaction analytics analyzes direct feedback to gauge how customers feel about their experience and identify areas for improvement. While behavioral data shows what customers do, satisfaction analytics reveals why they do it and how they feel about it. By systematically collecting and analyzing feedback through surveys, support tickets, and reviews, you can pinpoint friction points in your customer journey and prioritize improvements that will have the biggest impact on loyalty and retention.
Questions answered: What are the most common pain points in your customer journey? How does satisfaction vary by region or product?
Key data sources: Survey responses, support tickets, review data
Core metrics: Net Promoter Score (NPS), Customer Satisfaction Score (CSAT), Customer Effort Score (CES)
5. Customer Churn Analytics
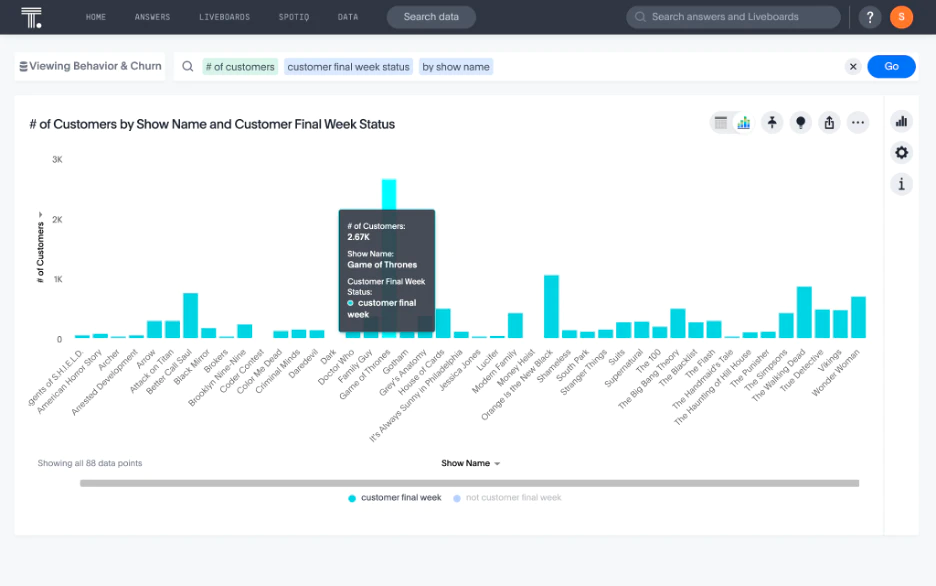
Retention analytics helps you understand why customers leave and what makes them stay, which is often more cost-effective than acquiring new customers. Churn analytics identifies the early warning signs, like declining usage, increased support tickets, and payment issues.
Predictive models can flag at-risk accounts so your team can intervene with targeted retention campaigns before it’s too late. By understanding what drives retention in your best customers, you can replicate those conditions across your entire base.
Questions answered: What are the early warning signs of churn? Which retention strategies work best for different segments?
Key data sources: Usage patterns, support interactions, billing history
Core metrics: Churn rate, retention rate, Net Revenue Retention (NRR)
6. Customer Lifetime Value Analytics
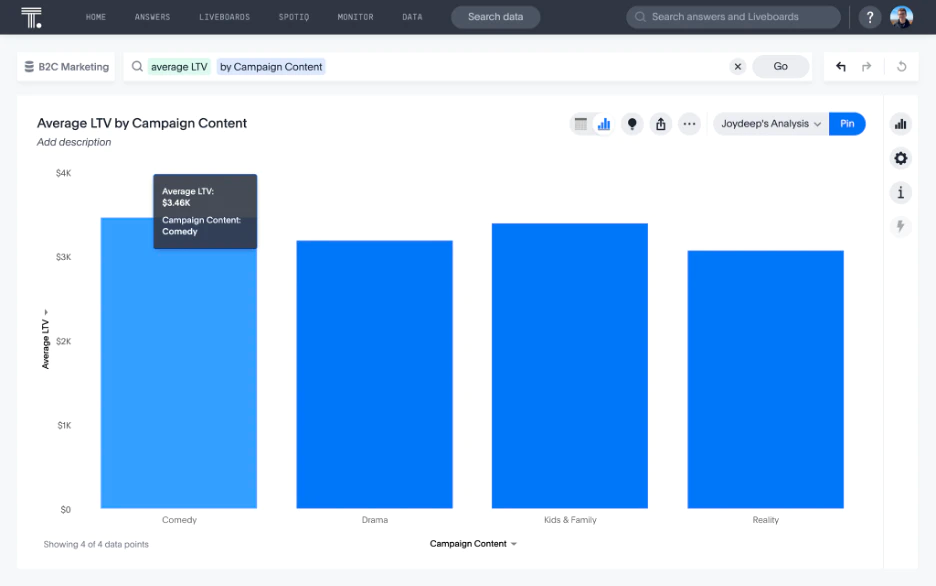
Customer lifetime value (CLV) analytics predicts the total revenue a customer will generate throughout their relationship with your business. It helps you focus on long-term value instead of short-term conversions. With CLV insights, you can justify higher acquisition costs for customers who deliver ongoing value, identify which segments deserve premium treatment, and invest where experience improvements will have the biggest payoff.
Questions answered: What's the predicted lifetime value of customers from different acquisition channels? How does CLV differ between segments?
Key data sources: Purchase history, subscription data, engagement metrics
Core metrics: Average purchase value, purchase frequency, customer lifespan
What data powers customer analytics?
To get the most from customer analytics, you'll want to combine multiple data sources to create a complete view of each customer. The more comprehensive your data, the more accurate your insights can become.
Your first-party customer data typically includes:
Demographic and firmographic data: Basic details like age, location, company size, and industry.
Knowing that a customer is a 500-person SaaS company in the healthcare vertical helps you tailor your messaging and product recommendations.
Psychographic and attitudinal data: Customer preferences, values, and motivations collected through surveys and preference centers.
Understanding that a segment prioritizes data security over cost allows you to emphasize the right features in your communications.
Behavioral and engagement data: How customers interact with your digital properties, including website clicks, app usage, feature adoption, and email engagement.
Tracking which features a customer uses daily versus which they've never touched reveals opportunities for education or upsell.
Transactional and purchase data: Complete purchase history including order frequency, average order value, payment methods, and subscription details.
Analyzing a customer's buying patterns—like seasonal spikes or consistent monthly purchases—helps you predict future revenue and identify expansion opportunities.
Support and operational data: Customer service interactions captured in support tickets, chat transcripts, and resolution times.
Spotting multiple tickets that a customer has submitted about the same issue identifies a clear signal of friction that could lead to churn.
Sentiment and Voice of Customer (VoC) data: Direct feedback from surveys, reviews, and social media mentions that reveal how customers feel about their experience.
Exploring a declining NPS score, combined with negative review themes, gives you specific areas to address before satisfaction issues become churn.
Ready to stop waiting for customer insights?
See how the Agentic Analytics Platform lets you ask any question about your customers and get instant answers. Start your free trial.
Key metrics and formulas
These formulas give you the quantitative foundation for measuring customer health, acquisition efficiency, and long-term value. Use them as building blocks for your dashboards and reports.
Churn rate
Formula: (Customers lost during period ÷ Customers at start of period) × 100
What it measures: The percentage of customers who stopped doing business with you during a specific timeframe.
Retention rate
Formula: ((Customers at end of period - New customers acquired) ÷ Customers at start of period) × 100
What it measures: The percentage of existing customers you kept over a given period.
Net Revenue Retention (NRR)
Formula: ((Starting MRR + Expansion - Downgrades - Churn) ÷ Starting MRR) × 100
What it measures: How much revenue you retain from existing customers, accounting for upgrades, downgrades, and churn. An NRR above 100% means your existing customers are growing in value.
Customer Acquisition Cost (CAC)
Formula: Total sales and marketing expenses ÷ Number of new customers acquired
What it measures: How much you spend to acquire each new customer across all channels.
Customer Lifetime Value (CLV)
Simple formula: Average purchase value × Purchase frequency × Average customer lifespan
What it measures: The total revenue you can expect from a customer throughout their relationship with your business. Note that predictive CLV models use machine learning to account for changing behaviors and provide more accurate forecasts.
Net Promoter Score (NPS)
Formula: % of Promoters (9-10 ratings) - % of Detractors (0-6 ratings)
What it measures: Customer loyalty and likelihood to recommend your product, scored from -100 to +100.
Customer Satisfaction Score (CSAT)
Formula: (Number of satisfied customers ÷ Total survey responses) × 100
What it measures: Short-term satisfaction with a specific interaction or experience, typically on a 1-5 scale.
Customer Effort Score (CES)
Formula: Average of customer ratings on effort required to complete an action (typically 1-7 scale)
What it measures: How easy or difficult it was for customers to accomplish their goal, like resolving a support issue or completing a purchase.
How customer analytics works (step-by-step)
Getting value from customer analytics doesn't require a massive overhaul of your entire data stack. The key is following a systematic approach that turns raw customer data into actionable insights your team can use immediately.
Here's how the process works at the most basic level:
Identify your business question: Start with a specific, high-impact question rather than trying to analyze everything at once. Questions like "Which customers are at risk of churning this quarter?" or "What acquisition channels deliver the highest lifetime value?" give you a clear target for your analysis.
Collect relevant data: Pull customer information from all the systems where it lives, whether that’s your CRM, web analytics, payment processor, support platform, or marketing automation tools. You don't need perfect data to start; you just need the data sources that relate to your specific question.
Organize in a central location: Consolidate your customer data in a cloud data warehouse or customer data platform (CDP) where it can be cleaned, standardized, and connected. This creates a single source of truth that eliminates conflicting reports and ensures everyone works from the same definitions.
Analyze with self-service BI and AI: Instead of waiting days for a custom report, use modern analytics platforms that let you explore data instantly. With Liveboards, you can monitor key customer metrics in real time, while AI-powered features let you ask follow-up questions in natural language and get immediate visual answers with no SQL required.
Act on insights: Share findings with relevant teams and implement changes based on what you've learned. This might mean launching a targeted retention campaign for at-risk customers, adjusting your pricing strategy, reallocating marketing spend to high-performing channels, or prioritizing product improvements that reduce friction.
Measure and iterate: Track the impact of your actions using the same analytics platform. Did your retention campaign reduce churn? Did reallocating the budget improve CAC? Use these results to refine your understanding, validate your hypotheses, and ask better questions in the next cycle.
The beauty of this approach is that each cycle builds on the last. As you answer one question, you'll naturally uncover new ones. With the right platform, you can explore those follow-ups immediately rather than waiting for another report.
Customer analytics solutions: Categories, evaluation checklist, and stack fit
The customer analytics landscape includes several solution categories, each designed to answer different questions about your customers. When you understand where each one fits, you can build a stack that delivers insights without creating new silos.
Solution categories
BI & AI analytics platforms like ThoughtSpot give you search-driven access to all your customer data, letting you ask questions in natural language and get instant answers through Liveboards. These platforms surface automated insights across your entire customer dataset, connecting behavioral patterns with transactional outcomes and satisfaction metrics in one place.
Product and behavior analytics tools specialize in tracking how users interact with your digital products. They excel at funnel analysis, feature adoption tracking, and cohort comparisons, making them valuable for product teams focused on activation and engagement.
Customer experience and Voice of Customer (VoC) suites focus on collecting and analyzing direct feedback through surveys, reviews, and sentiment analysis. These tools help you understand the "why" behind customer behavior by capturing qualitative insights at scale.
Customer Data Platforms (CDPs) and journey orchestration tools unify customer profiles across touchpoints and activate that data for personalization and campaign execution. They're designed to operationalize customer data rather than analyze it, though many now include basic analytics capabilities.
Evaluation checklist for customer analytics platforms
The difference between platforms that accelerate decisions and those that slow them down often comes down to how well they balance speed, trust, and usability. Here’s what to look for:
Self-service accessibility: Can non-technical users explore customer data independently, or does every question require analyst intervention? True self-service means marketing, product, and customer success teams can get answers without creating bottlenecks.
Data governance and security: Does the platform enforce row-level security, role-based access, and audit logging to protect sensitive customer information while maintaining compliance?
Live data connectivity: Are you analyzing current customer behavior or yesterday's snapshot? Warehouse-native platforms connect directly to your data without replication latency or storage duplication costs.
AI-powered insights: Does the platform proactively surface important changes in customer behavior, or do you have to remember to check dashboards manually? Look for intelligent alerting and AI analysts that let you ask follow-up questions naturally.
Trusted metrics and lineage: Can you trace calculations back to their source? When someone searches for "churn rate," does everyone get the same certified definition, and can you show exactly how it's calculated? This is where it’s critical to understand how the semantic layer of your analytics system functions.
ThoughtSpot for customer analytics
ThoughtSpot eliminates the trade-off between power and accessibility. Anyone can ask questions about customers in natural language and get instant visual answers. The governed semantic layer ensures consistent definitions across teams, while Spotter, your AI Analyst, lets you drill into anomalies conversationally and surfaces important changes proactively.
Because ThoughtSpot connects directly to your cloud data warehouse, you're always analyzing live data. This gives you the flexibility to combine customer insights with any other business data without creating new silos or waiting for custom integrations. The result is a complete view of your customers that updates in real time and scales with your business.
Challenges and governance in customer analytics
Customer analytics delivers powerful insights, but it also introduces real challenges around issues like privacy and data quality. Ignoring these issues can expose your business to regulatory penalties, erode customer trust, and lead to decisions based on flawed data.
1. Privacy and compliance: Regulations like GDPR and CCPA require explicit consent for data collection, clear mechanisms for customers to access or delete their information, and documented breach processes. Cookie deprecation has made third-party tracking unreliable, forcing a shift toward first-party data strategies.
Mitigation: Work with platforms that offer built-in compliance management and prioritize first-party data collection through owned channels.
2. Data quality and observability: Bad data leads to bad decisions. When customer records are duplicated, fields are inconsistently formatted, or pipelines break silently, your analytics become unreliable.
Mitigation: Track data quality metrics with automated checks and monitor pipelines with observability tools that detect anomalies and trace lineage.
3. Skills and tools costs: Traditional customer analytics requires specialized skills in SQL and data modeling, creating bottlenecks when only a few people can answer questions. Tool sprawl adds licensing costs and integration complexity.
Mitigation: Choose self-service platforms that let non-technical users explore data independently using augmented analytics and the power of AI.
How can your team use customer analytics?
Customer analytics delivers different value depending on your role, but the common thread is clear: when insights are accessible and actionable, everyone wins.
Here's how each team can put customer analytics to work:
1. Marketing teams
Stop guessing which campaigns work and start proving ROI with data:
Analyze CAC by channel: See exactly how much each marketing channel costs to acquire a customer, then shift budget to what's working.
Identify high-value creative assets: Discover which messaging, images, and offers drive customers with the highest lifetime value, not just the most clicks.
Pinpoint conversion drop-offs: Spot exactly where prospects abandon your funnel and fix the friction points that cost you revenue.
2. Product teams
Build what customers actually use and remove what they don't:
Track feature adoption rates: Understand which features drive engagement and which don’t, so you can prioritize your roadmap based on real usage.
Identify activation drivers: Discover the specific actions that turn new signups into active users, then optimize your onboarding to replicate that path.
Measure time-to-value: Calculate how long it takes new customers to experience their first win, then compress that timeline to improve retention.
3. Customer success teams
Prevent churn before it happens and scale your impact:
Build predictive health scores: Combine usage patterns, support interactions, and engagement metrics to flag at-risk accounts before they churn.
Analyze support ticket themes: Surface the most common pain points across your customer base so you can address systemic issues instead of one-off problems.
Track NPS trends by segment: Monitor satisfaction across different customer groups to identify which segments need attention and which strategies are working.
4. Sales teams
Focus your time on the deals most likely to close and grow:
Prioritize leads by conversion propensity: Use predictive scoring to focus on prospects who match your best customers' profiles and behaviors.
Identify expansion opportunities: Spot existing accounts showing signals of growth potential, such as increased usage, new team members, or engagement with premium features.
Forecast revenue with behavior patterns: Move beyond gut feel by predicting deal closure and expansion revenue based on how similar customers have behaved in the past.
Put your customer data to work
Understanding your customers is what separates growing businesses from stagnant ones. The question isn't whether you need customer analytics, but whether you're getting insights fast enough to act on them.
With a search-driven approach to customer analytics, you can move from question to insight in seconds, not days. Instead of waiting for reports or bothering your data team with every follow-up question, you can explore your customer data as naturally as you'd search the web.
Stop waiting for insights buried in dashboards. Try ThoughtSpot free and start exploring your customer data with natural language search, intuitive visualizations, and native integrations for your most critical data sources.
Customer analytics frequently asked questions
What does "analytics on customer data" mean?
"Analytics on customer data" refers to analyzing customer information to understand behavior and drive decisions. For example, you might combine web analytics showing declining usage, CRM data revealing missed renewals, and support tickets indicating unresolved issues to predict churn risk. With that insight, you can trigger targeted retention plays—like assigning a customer success manager—before customers leave.
Customer analytics vs. product analytics—what's the difference?
Customer analytics focuses on understanding people across the entire customer life cycle: who they are, how they behave, what their business is worth, and why they stay or leave. Product analytics zooms in on feature usage within your application: which buttons get clicked, where users drop off, and how they navigate your interface. Both types of analytics are important, but they answer fundamentally different questions.
What data do I need to start with customer analytics?
You don't need perfect data to start. Usually, three core sources are enough to get going:
Engagement data: How customers interact with your brand (website visits, email opens, product usage)
Transactional data: Purchase history and revenue patterns
Support and feedback data: Information from tickets, surveys, and customer conversations
These three sources give you enough signal to answer high-impact questions about acquisition, retention, and lifetime value.
Which tools count as "customer analytics solutions"?
Customer analytics solutions fall into four main categories:
BI and AI analytics platforms like ThoughtSpot let you explore all your customer data with natural language search and automated insights.
Product analytics tools specialize in tracking digital interactions and feature adoption.
Customer experience suites focus on collecting and analyzing feedback through surveys and sentiment analysis.
Customer Data Platforms unify profiles across systems and activate that data for personalization.
How often should I refresh customer analytics models and dashboards?
It depends on your use case. For strategic reporting like quarterly business reviews, weekly or monthly refreshes often work fine. For operational metrics like marketing performance or sales pipeline, you'll want daily updates at a minimum. For real-time applications—churn risk scoring, personalization engines, or fraud detection—you need live data connectivity that updates continuously.


