

Life After Dashboards
Monthly active user rates stuck at 23%. A Slack message about another client who can't find the data they need. A support ticket your team has started to joke about: “Can you export this to Excel?”
Once upon a time, embedding dashboards inside your product was a differentiator. Today, this is what the feedback looks like when your analytics stop working.
AI agents can now respond to complex questions with meaningful insights in seconds. The bar for what "good" looks like has moved, and customers don't want to look at data—they want to talk to it, explore it, and act on it. In fact, by the end of 2026, more than 80% of users will consider this experience the baseline, making static dashboards a relic of the past.
Keep reading for a breakdown of where traditional embedded BI dashboards are failing your customers, the three shifts required to transition to AI-powered analytics, and the results top companies see once they make the switch.
Where Traditional Embedded Analytics Falls Short
Legacy embedded analytics were built to solve a problem that customers no longer have. That mismatch shows up in four specific places:
1. The Cost of Scale
Legacy embedded analytics platforms price per user, a model that made sense when analytics was a power-user feature. But now every customer needs access to data to do their jobs. The math works against you either way: absorb the cost and your margins compress as customers scale. Pass it through and your product becomes harder to justify over time. Either way, there's an artificial ceiling on how broadly customers can adopt your analytics.
The platforms built to solve this problem have moved away from offering per-seat pricing models only, aligning cost to usage or business outcomes rather than headcount. When the pricing model matches how the product actually grows, the ceiling disappears.
2. Static vs. Dynamic Data
Traditional embedded analytics displays data. These dashboards and reports are designed in advance, delivered on a timer, and built around questions someone predicted customers would have. The result is analytics that are outdated the moment they’re published.
Static, retrospective charts may tell teams what happened, but they can’t help them understand why it happened, and they definitely don’t empower them to do anything about it. As Gartner puts it, analytics that stop at displaying a chart or a metric have become "analytic wallpaper"—a nice background for decisions that are being made somewhere else.
3. The Maintenance Burden
With legacy embedded analytics, every new customer request means a new dashboard. Every new dashboard means another artifact to maintain. API updates, security changes, new data sources—the complexity accumulates until what started as a feature becomes a parallel product, competing with your core roadmap for the same engineering resources. This is especially true in today’s agentic AI era.
The team you hired to build your product ends up running an internal analytics platform instead. And before you know it, your core product is falling short of the promises it makes your customers.
4. Self-Service for Non-Technical Users
Most customers aren't data analysts. They're operators, managers, and specialists who need answers to do their jobs—and they shouldn't need to know how a dashboard was built to get them. But traditional embedded analytics requires exactly that. When someone needs something outside what was pre-built for them, there's no plain-language way to ask for it.
The request goes to a queue, the queue has a backlog, and by the time the answer arrives the decision has already been made without it. That's the real cost of analytics that assumes technical fluency—not just friction, but decisions made without the data that was supposed to inform them. It erodes customer confidence that your product can deliver in critical moments.
Three Shifts to Move Toward AI-Powered Embedded Analytics
These four failures aren't independent bugs to patch. They're symptoms of the same underlying architecture—one designed to display data, not to help people use or act on it. Similarly, moving from traditional embedded analytics to an AI-powered experience isn't just a technology upgrade. It's a fundamental change in the way users expect to interact with data and the relationship between your product and your customers' decisions. Here are the three shifts product leaders must embrace to successfully make the move.
Shift 1: From Passive to Active
In the legacy model, analytics is a destination. Customers navigate to a dashboard, look at what's there, and leave. What they see is what they get—and what they get is a rearview mirror of static, surface-level performance they can no longer impact.
In an AI-powered model, analytics is a participant. It surfaces what's relevant before users ask, flags anomalies as they emerge, and responds to follow-up questions with context intact. And it doesn’t stop there: It also helps facilitate action by allowing users to transition from insight to decision without leaving their workflow.
Customers stop thinking of your analytics as a reporting section and start thinking of it as a working partner. It’s no longer a rearview mirror, but a windshield—and they can’t look away.
Shift 2: From Technical to Conversational
Traditional embedded analytics requires users to know the system. Which dashboard has that metric? What filter do I need to apply? How do I combine these two data sources? These are questions that require training, data familiarity, and patience—none of which your customers should have to invest in.
AI-powered embedded analytics requires users to know only what they want to know. They type a question in plain language, and the system interprets their intent, queries the right data, and returns an answer they can act on
This shift from technical to conversational isn't cosmetic. It's the difference between customers who use your analytics once a week and customers who use it every time they make a decision. The lower the barrier to asking a question, the more questions get asked, and the more essential your product becomes.
The shift toward more conversational user experiences extends to development as well.
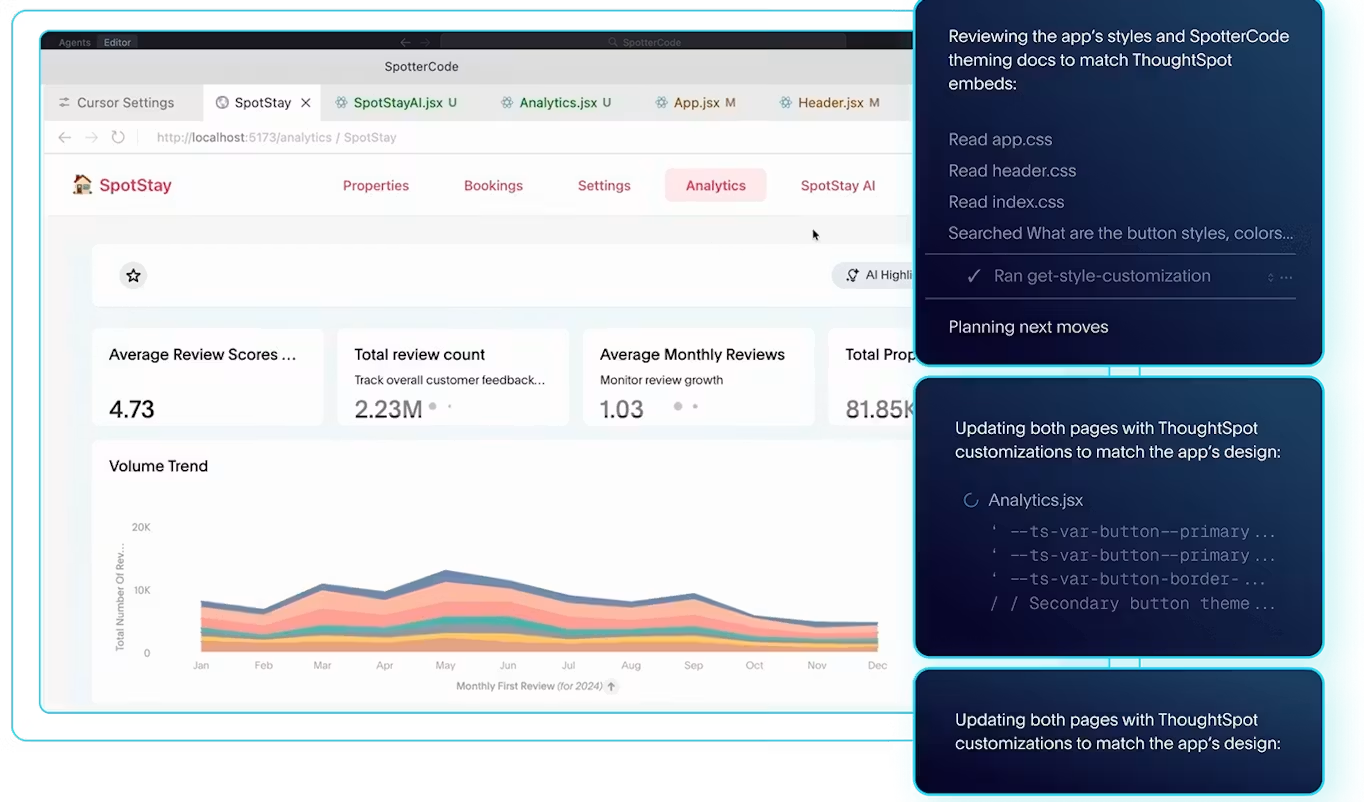
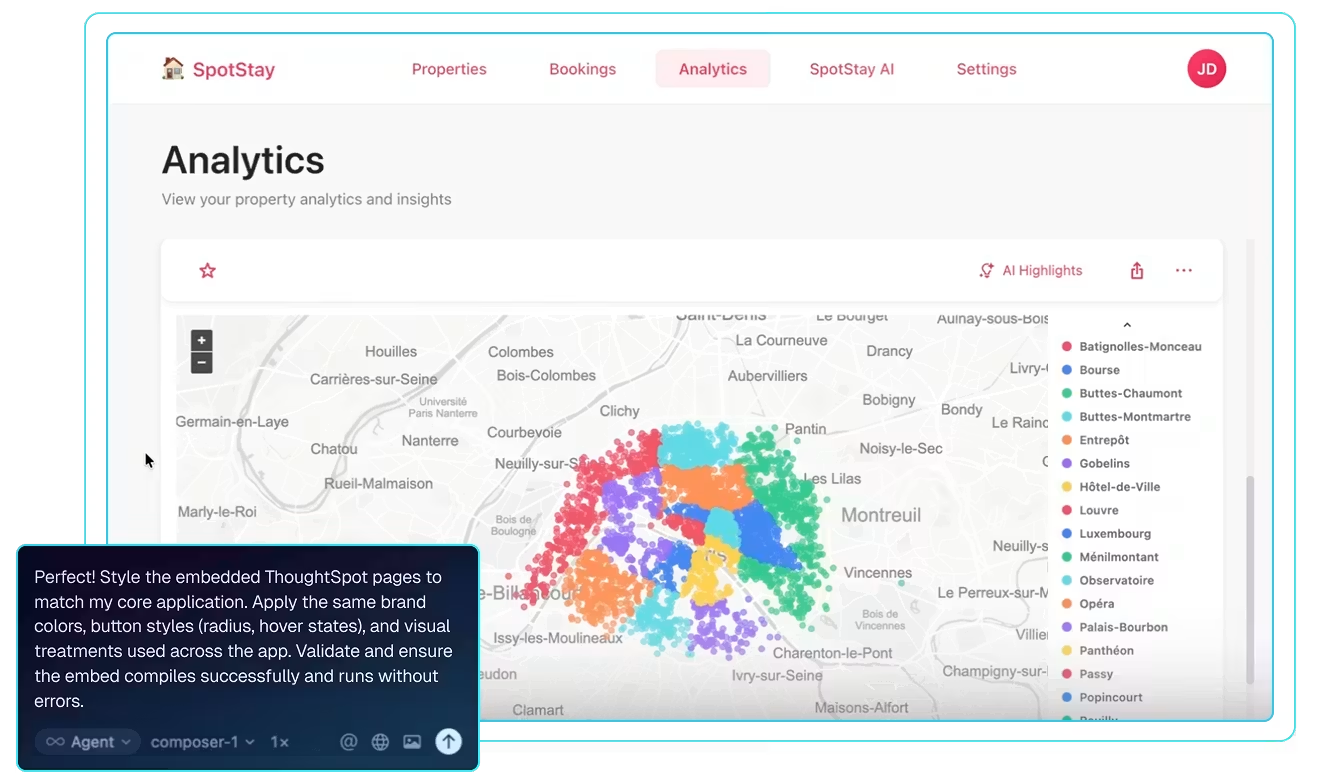
Tools like SpotterCode, an AI coding agent that generates production-ready embedded analytics code directly in your IDE, mean even developers no longer have to learn and translate business requirements into SDK calls from scratch.
The barrier to building the experience is as low as the barrier to using it.
Shift 3: From Predetermined to Exploratory
Legacy embedded analytics is built on prediction: What questions will customers ask? The dashboard is the answer to that prediction. When reality diverges from that assumption and a customer wants to ask something the dashboard wasn't built to answer, the experience breaks.
AI-powered embedded analytics is built on curiosity. Users aren't limited to the questions your team anticipated. They can explore in any direction, drill into any dimension, and follow threads of inquiry wherever they lead—without submitting a custom request or waiting for a new dashboard to be built.
This shift from predetermined to dynamic changes what embedded analytics means for customer outcomes. Instead of giving customers a view of their performance, you're giving them the ability to understand it and act on it without ever leaving your product. That's what it means to build an intelligent app, and that's significantly harder for competitors to replicate.
What Success Looks Like in Practice: Loan Market Group
The three shifts above can sound abstract until you see them in a real product, with real users, and real results. Loan Market Group is one of the clearest examples in the market of what happens when a product team moves from legacy embedded analytics to an AI-powered experience—and what it does for customer adoption.
The Before
Loan Market Group is Australia's largest mortgage aggregator. Their flagship product, MyCRM, is a broker's complete business solution, giving mortgage professionals everything they need to manage their business in one place. But when it came to analytics, MyCRM had a problem.
Reports were built on a combination of legacy tools and homegrown solutions that were, in the words of the team, "too inflexible to answer every single question that their customers had." Brokers who wanted to understand their own performance—deal pipeline, client activity, portfolio trends—were dependent on custom reports and analyst support for questions that should have been self-serve.
The metrics didn’t lie: Only 23% of users were actively engaging with the analytics component of MyCRM each month. They weren't data analysts—they were mortgage professionals who needed fast answers to stay competitive in a tight market. And when the analytics couldn't give them those answers quickly, they stopped trying.
The Decision
In early 2022, Loan Market Group began evaluating AI-first embedded analytics platforms. The solution needed to feel native to MyCRM and support a non-technical broker audience. They also couldn't afford a months-long implementation that disrupted their existing user experience.
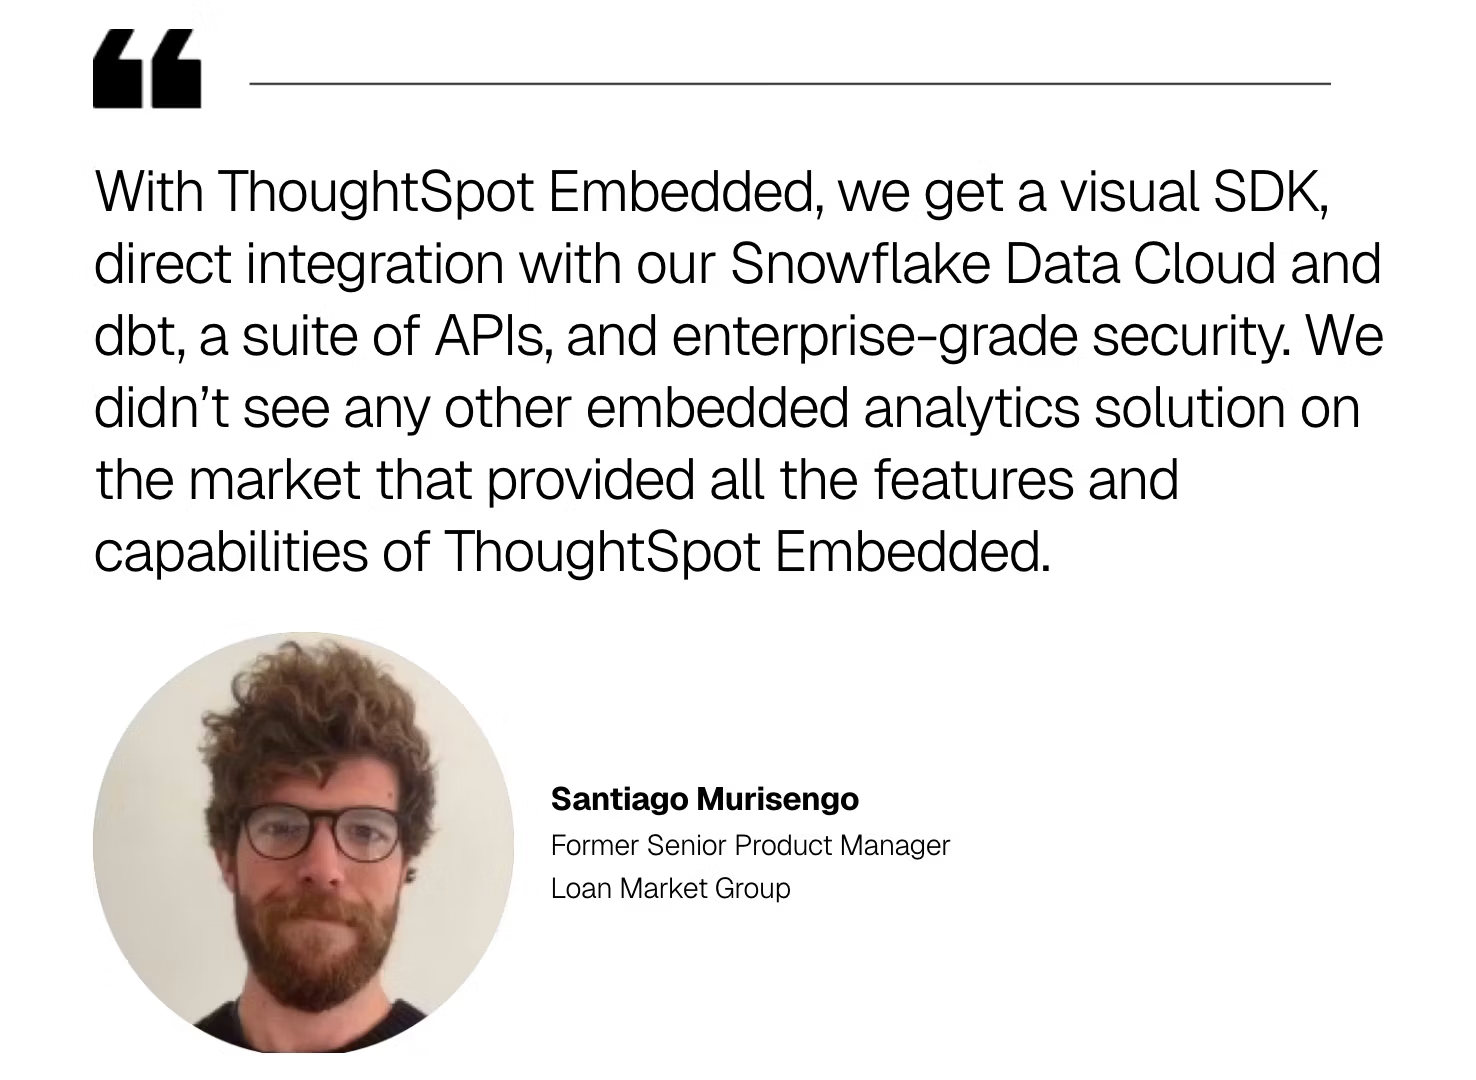
After evaluating their options, they chose ThoughtSpot Embedded, specifically for its industry-leading conversational analytics capabilities. The implementation took less than three months from project start to launch, and as their former Senior Product Manager put it: "We knew we had found the key to dramatically accelerating our time to market for a seriously sticky and interactive version of the product."
The Impact
The results Loan Market Group has experienced with ThoughtSpot track directly to the three shifts described in this blog.
From passive to active: Brokers who were used to having a one-way conversation with high-level performance dashboards can now ask a direct question and get a direct answer. Analytics has become a working partner that proactively powers smarter decisions, not just “pretty wallpaper” they passively glance at every so often.
From technical to conversational: The natural language interface means brokers with no data background can self-serve on questions that previously required analyst involvement. The system speaks their language—mortgages, clients, pipeline, deals—not the language of data models and formulas.
From predetermined to exploratory: Instead of being limited to the questions the legacy dashboards were built to answer, brokers can follow their own lines of inquiry. A question about pipeline performance can lead to a question about client activity, which can lead to a question about regional trends—all in a single session, without filing a request.
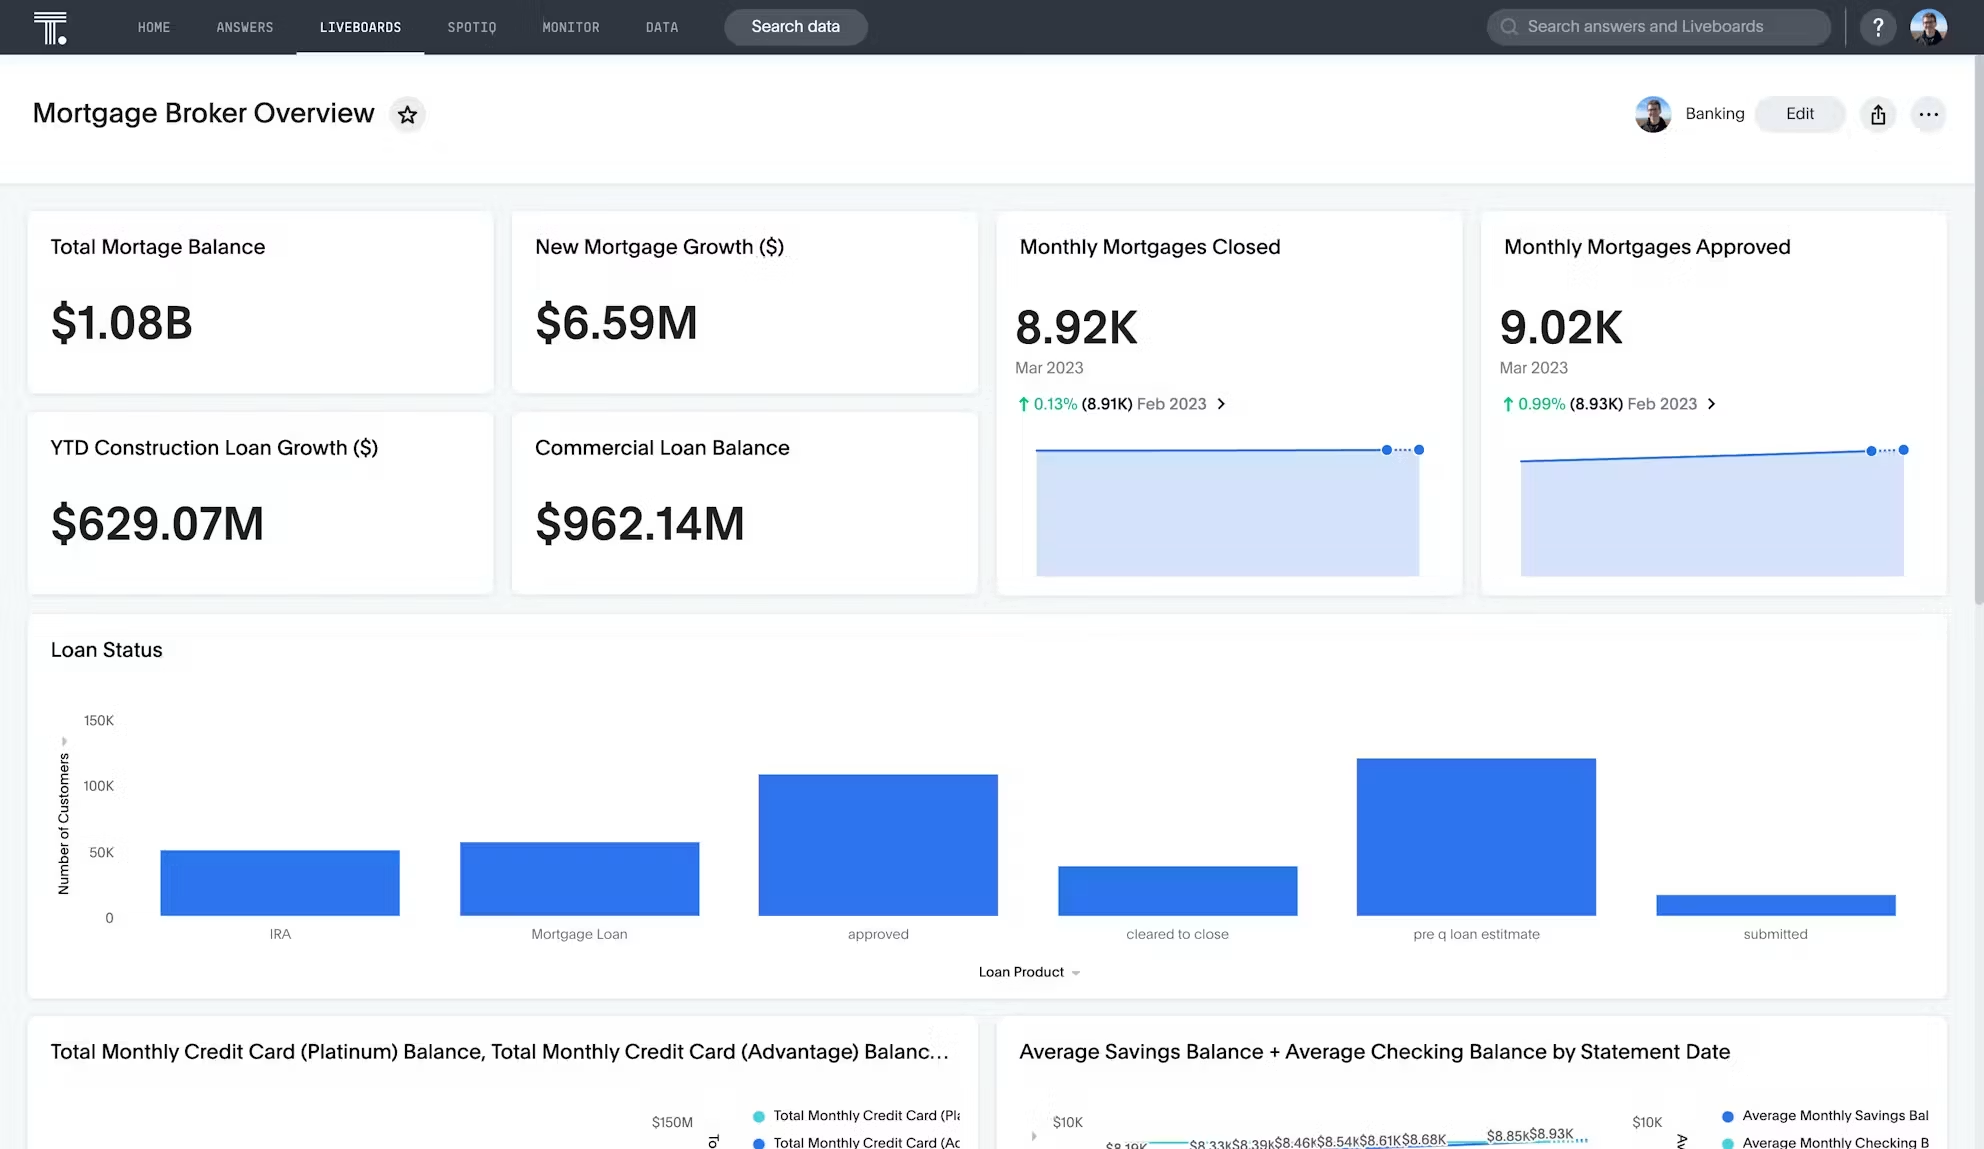
The best part? Monthly active analytics users were projected to more than double from 23% to 53% within months of launch. The platform has scaled to support 8,000+ users without the cost and complexity of per-user licensing. And for the first time, Loan Market Group has analytics it can use as a competitive differentiator in enterprise conversations.
Make Your Customers Love Your Analytics
The space between your customers' expectations and what traditional embedded analytics can deliver isn't a feature gap. It's an architecture gap. Closing it requires more than updating dashboards. It requires rethinking what analytics inside your product is supposed to do.
The three shifts outlined in this blog—from passive to active, from technical to conversational, from predetermined to exploratory—aren't aspirational. They're already happening in products like Loan Market Group's MyCRM. The product leaders who make these shifts now are building customer relationships that are stickier, more valuable, and significantly harder for competitors to disrupt.
The ones who don't are shipping a product that's falling behind every quarter—not because their core value proposition is weak, but because the analytics layer is quietly undermining it.
Ready to see what AI-powered embedded analytics looks like inside your product? Schedule a demo.


