


ChartSpec is the typed Grammar-of-Graphics spec at the heart of Charts AI: small enough for a model to speak fluently, expressive enough to compose almost any chart, and independent of whatever renders it.
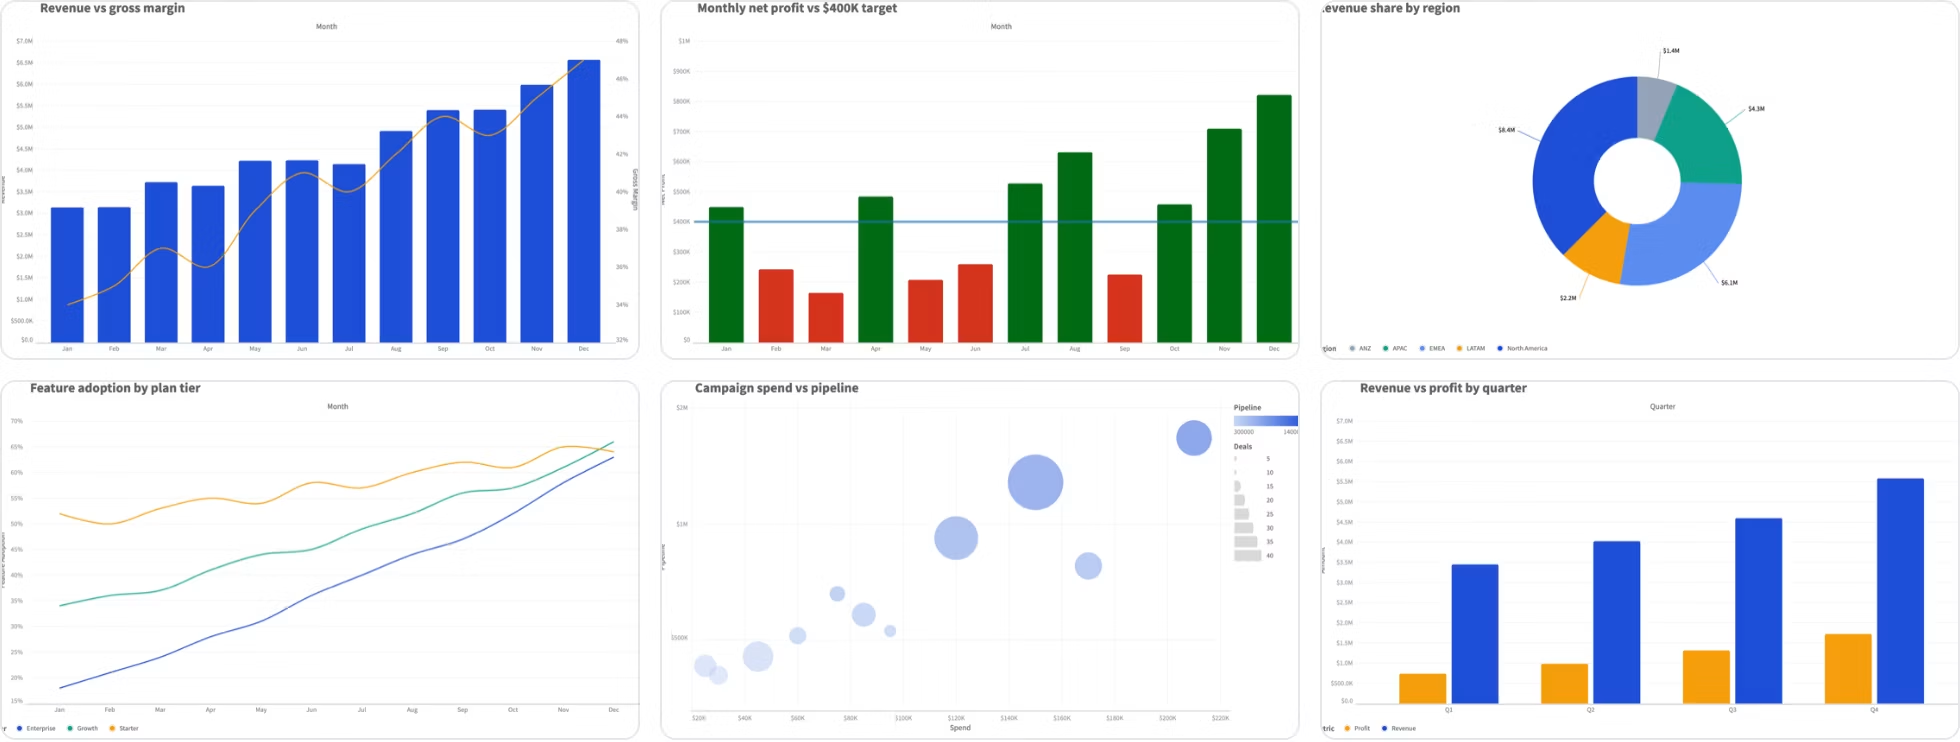
Ask a modern BI product a question—"which products are losing money?"—and you expect a chart back, not a form to fill in. Getting there with a large language model sounds straightforward until you hit the architectural question hiding underneath: what, exactly, should the model produce?
Its answer decides almost everything downstream: what you can verify, what you can render on, what a user can refine, and what breaks when the data changes tomorrow. Charts AI, ThoughtSpot's natural-language charting service, is built around one answer to that question, and this post is about the artifact at its center.
Getting there means ruling out three tempting answers, then walking through three properties that make the one we landed on work: reliably emittable by a model, independent of any rendering backend, and able to double as the conversation's own memory.
Three Obvious Answers, Three Dead Ends
The industry has mostly tried three things.
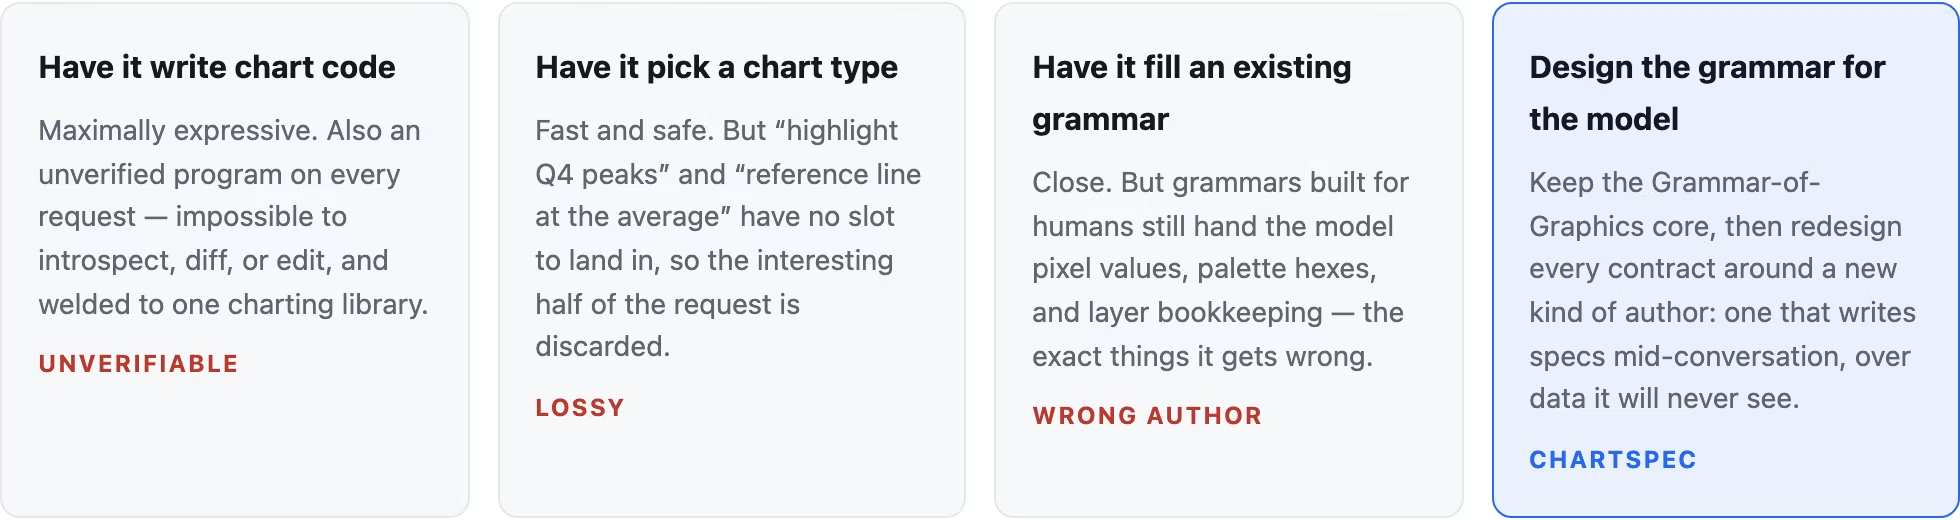
The third door deserves a closer look, because it’s almost right. Declarative visualization grammars in the Grammar-of-Graphics tradition (the lineage running from Wilkinson through ggplot2 and Vega-Lite) describe charts as compositions of marks, encodings, scales, and facets, rather than as a taxonomy of named types.
That is exactly the right shape for a model target, for three reasons we only fully appreciated in production:
1. Compositionality Matches How User Intent Arrives
Users don't ask for chart types; they ask for comparisons with emphasis: "sales by region, but flag the laggards." A grammar absorbs the emphasis as one more rule on one more channel. An enum forces a lossy projection.
2. Grammar Is a Verifiable Contract
A spec can be validated structurally, diffed in review, replayed in tests, and compiled deterministically. None of that is true of generated code.
3. Grammar Bounds Hallucination by Construction
A model emitting a closed vocabulary of marks and channels cannot invent an API surface. Failures shrink from "arbitrary wrong program" to "wrong term in a known algebra," i.e., a class you can detect, and often repair.
What the classic grammars don't supply is a language whose author is a model writing from table metadata, mid-conversation, over data it will never see.
That authorship changes the design. ChartSpec is what came out.
The Spec is the Seam
ChartSpec is a typed visualization grammar based on the Grammar-of-Graphics dialect, and it is deliberately small: sixteen top-level fields, eight marks, fifteen encoding channels, six sort types, one compact condition algebra.
That smallness is the point, not a limitation: the vocabulary is narrow enough for a language model to emit reliably, and the constructs compose into an expressive range far larger than the surface suggests. Everything in Charts AI meets it.
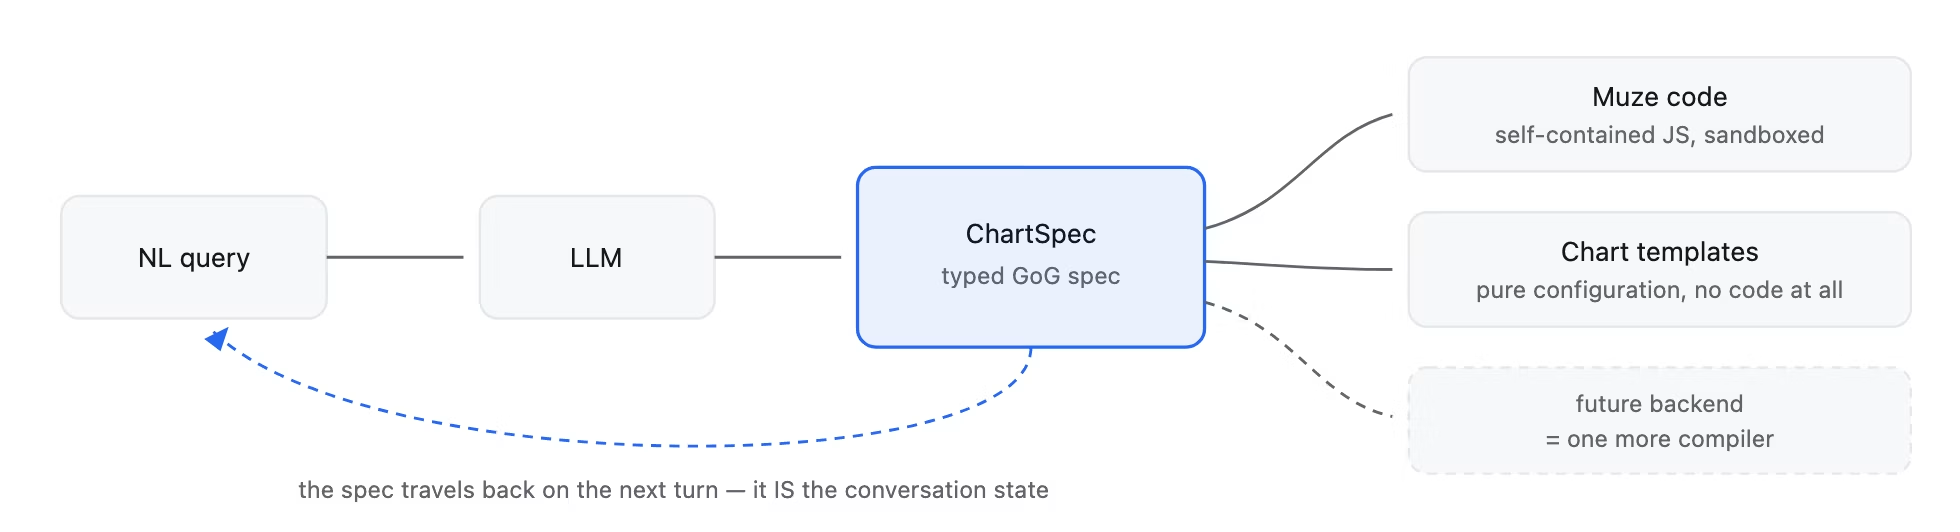
Three properties define it, and the rest of this post walks through them: it is reliably emittable by a model, it is independent of any rendering backend, and it doubles as a conversation state.
Before the Spec: Decomposing the Ask
How does spec-writing begin? Before any spec exists, the utterance is broken down into a small set of analytical judgments: the questions a human analyst answers in the first three seconds.
What is the user trying to do: compare things, track change, examine a distribution, find a relationship, single something out? What structural family serves that goal?
What role does each field play: positional axis, series overlay, panel split? Does all the data matter, or just the top of it?
And what, if anything, deserves emphasis?
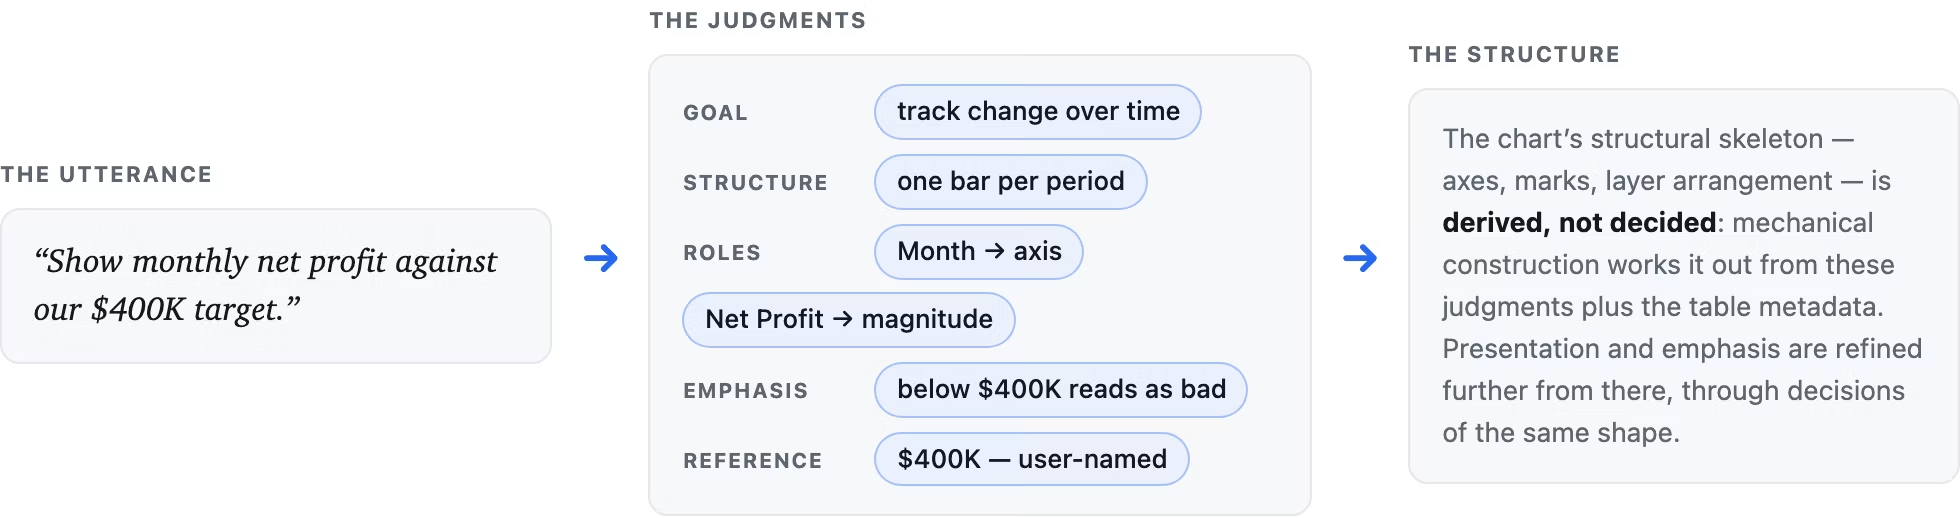
Two things make this decomposition load-bearing:
First, each judgment is a choice from a closed vocabulary of analytical situations; this is exactly where the enumerations live, one level above the artifact.
Second, the judgments are separable from construction: once they are made, turning them into structure is mechanical, so it is done by code that validates against the table's realities (field cardinalities, units, metadata), rather than by the model free-handing structure.
Decomposition alone does not finish a spec (presentation and emphasis are decided in further passes of exactly the same shape), but the split holds at every stage: the model judges, code constructs.
That separation, more than any prompt engineering, is what makes spec generation reliable.
There is No Chart-Type Field
Search the entire language, and you will not find a field that names a chart type. A "stacked bar" is a bar mark with a color encoding and a stack transform.
A "donut" is an arc mark with a nonzero inner radius. A "histogram" is a bar mark over a binned derived field. Chart identity is a property the reader computes, never a value the author asserts.
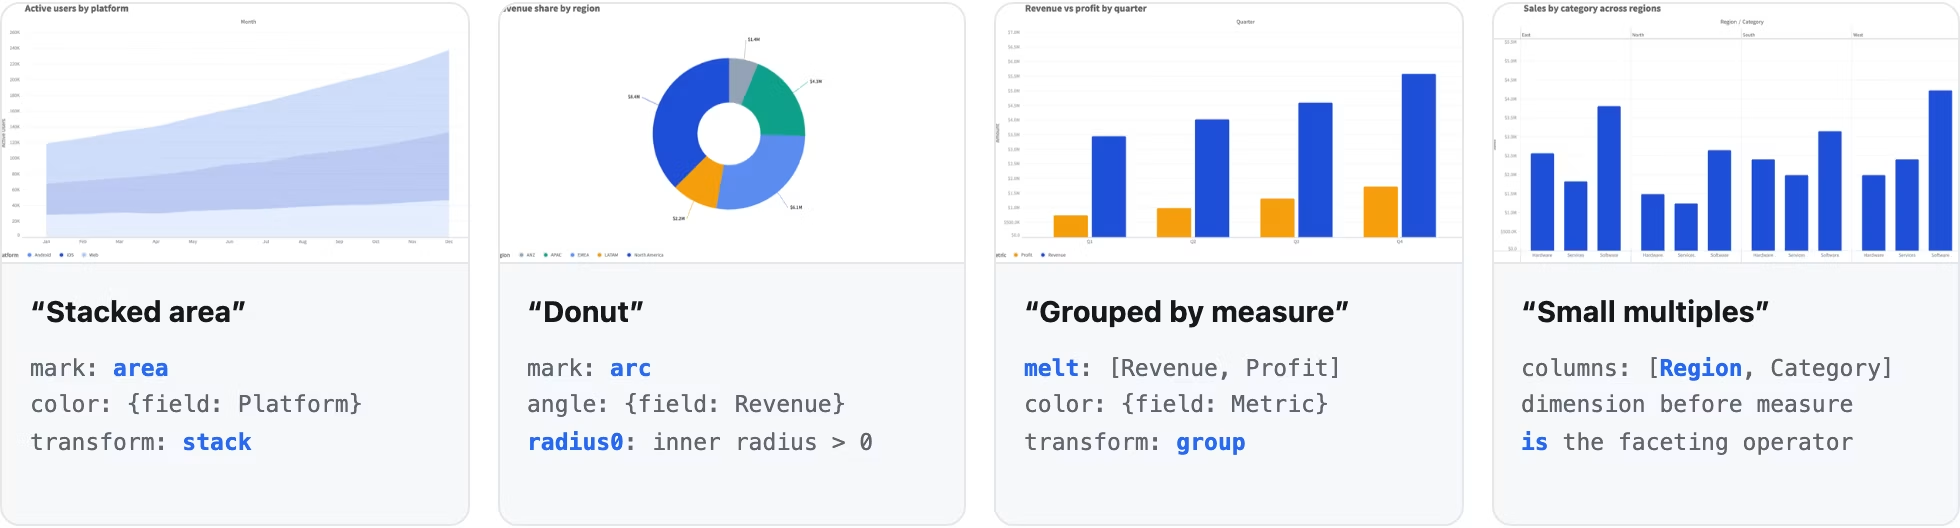
This is orthodox Grammar-of-Graphics, but under a model author it earns its keep in three new ways:
Expressiveness grows multiplicatively: Every new mark or channel composes with everything that exists, which is why user requests we never anticipated keep landing inside the language.
An entire failure class disappears: An asserted type can never disagree with the actual structure, because only the structure exists.
And revision stays local: "Make it stacked" is a one-field change to a transform, not a re-classification that invites the model to rebuild (and subtly alter) everything else.
An enum is a decision vocabulary, not an artifact vocabulary. Where the system genuinely needs discrete choices, they live in routing, never in the chart.
Composition is the whole game
The heart of the language's expressive range is a small algebra for laying out axes. Each side of the chart (rows, columns) is a list of entries built from three primitives—a single field, a merged set of same-unit fields sharing one scale, and a positional placeholder—and a side can split in two to express opposed dual axes.
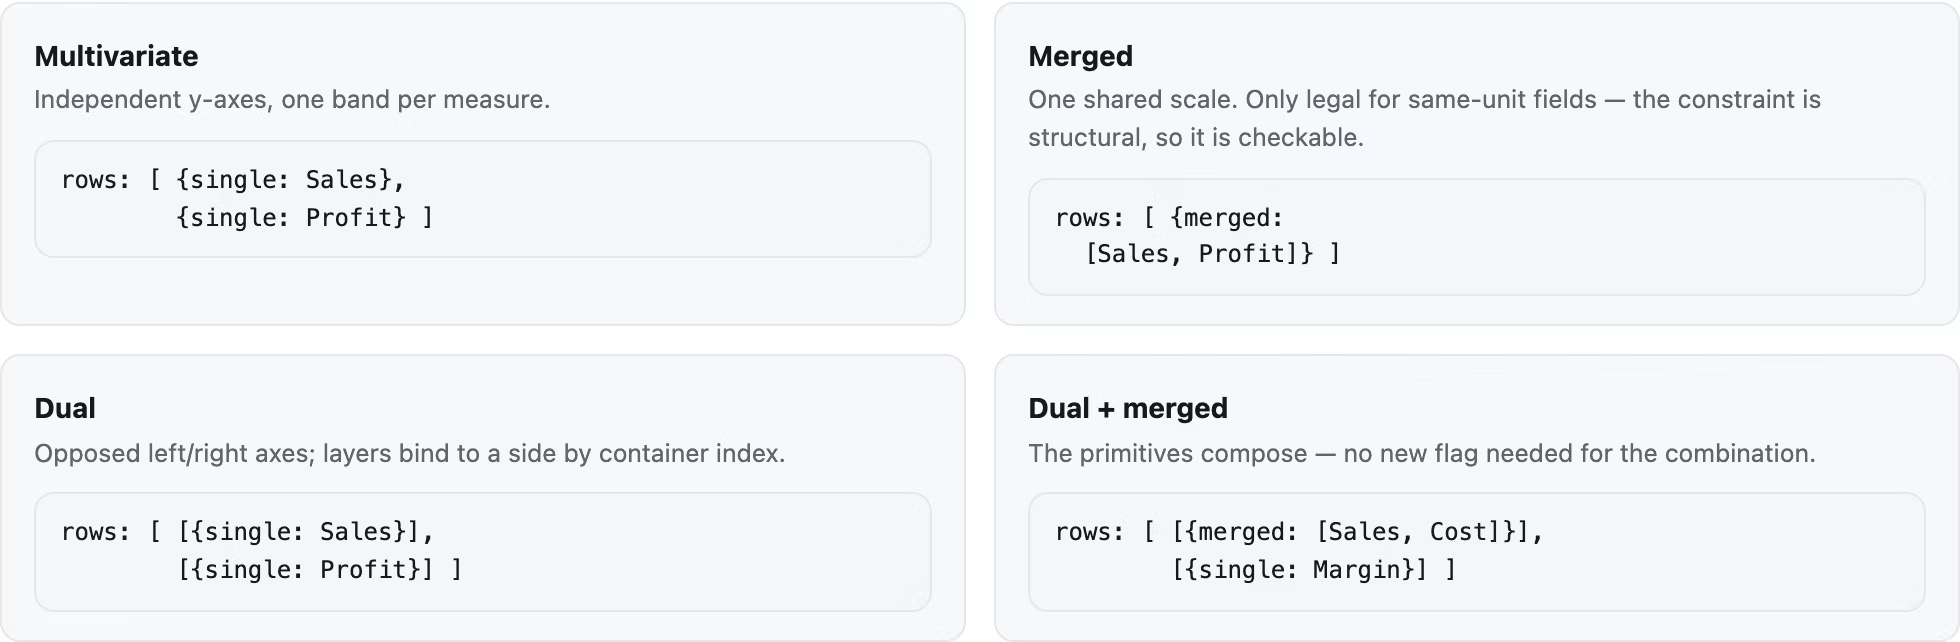
Dimensions listed before measures on a side become facets—position in the list is the faceting operator. And a first-class melt (unpivot) construct rounds out multi-measure composition: fold N same-unit measures into a categorical "metric" column, and the measure identity becomes ordinary data that every channel and transform already knows how to handle. Color-by-measure lines, stacked-by-measure bars, mark-per-measure combos—all fall out, no special cases.
Layering is the second composition axis: a bar layer plus a rule layer is a chart with a reference line; a bar layer and a line layer bound to opposite dual sides is a combo chart. Between multivariate, merged, dual, and melt, the same set of measures has four different analytical readings—each one structural edit away from the others.
Emphasis is data, not code
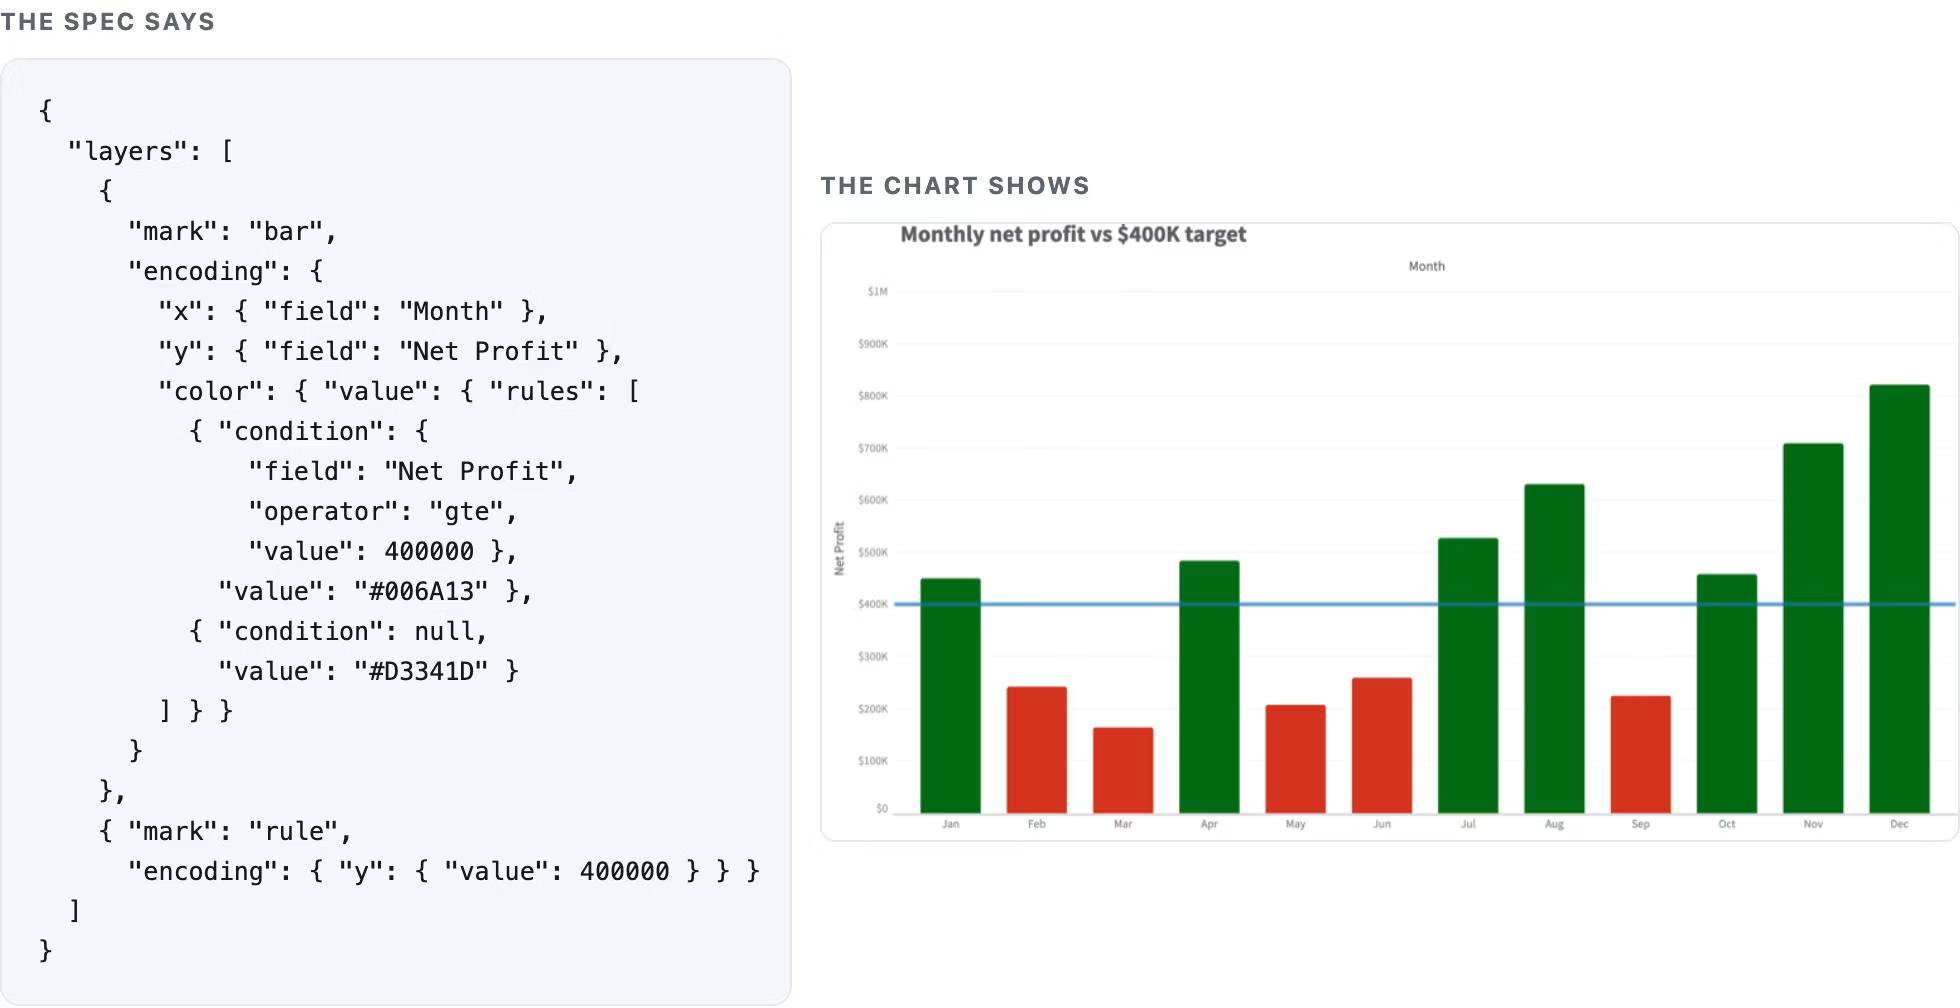
The part of user intent that chart-type systems drop on the floor is emphasis: "flag the laggards," "show it against our target." In ChartSpec, any color, opacity, or size channel can carry an ordered list of condition-to-value rules, where conditions form a recursive Boolean algebra over eight comparison operators—and a reference line is just one more layer, a rule mark carrying a value.
Never let the model see a number it could compute
Ask an LLM for "a reference line at the average" and it will happily write value: 4211.37—a number synthesized from sample values, column statistics, or thin air. This was not a hypothetical for us; it was an entire class of production incidents.
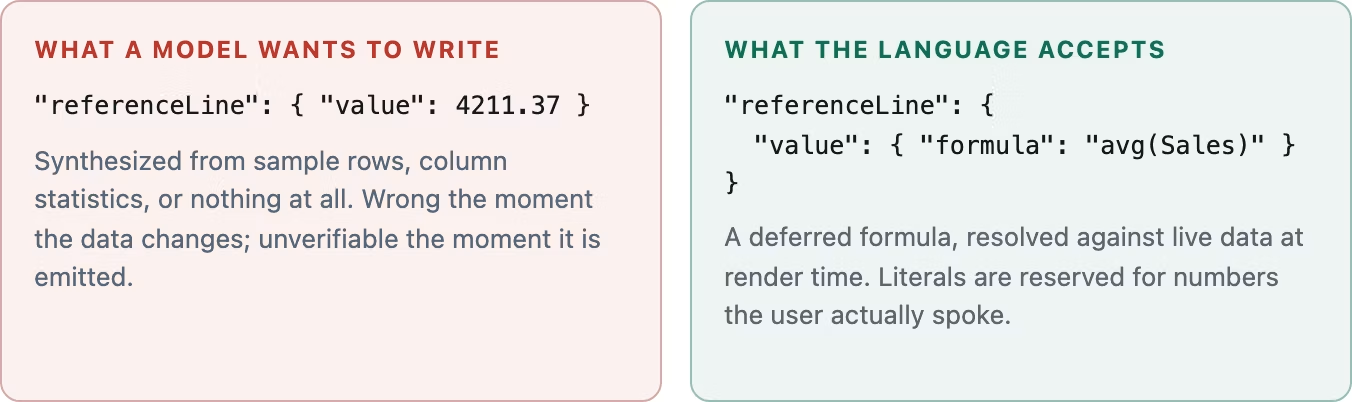
We call the convention data-value discipline, and its consequence is the language's quiet superpower: specs are data-stable. The same ChartSpec is correct over tomorrow's data, next quarter's data, another tenant's data with the same schema. A saved chart never fossilizes a stale average into its definition. In a BI setting, that single property separates a demo from a product.
One spec, many backends
ChartSpec commits to what the chart is—never to how a library draws it. No construct in the language names a renderer concept; every construct is stated in chart semantics. That is not hygiene for its own sake. It is what lets the same spec compile, today, into three very different artifacts: a self-contained Muze chart program that runs in a sandbox, Muze Studio SDK code that drops into our authoring surface as a starting point, and—no code at all—a native chart-settings payload that configures ThoughtSpot's built-in chart types directly.
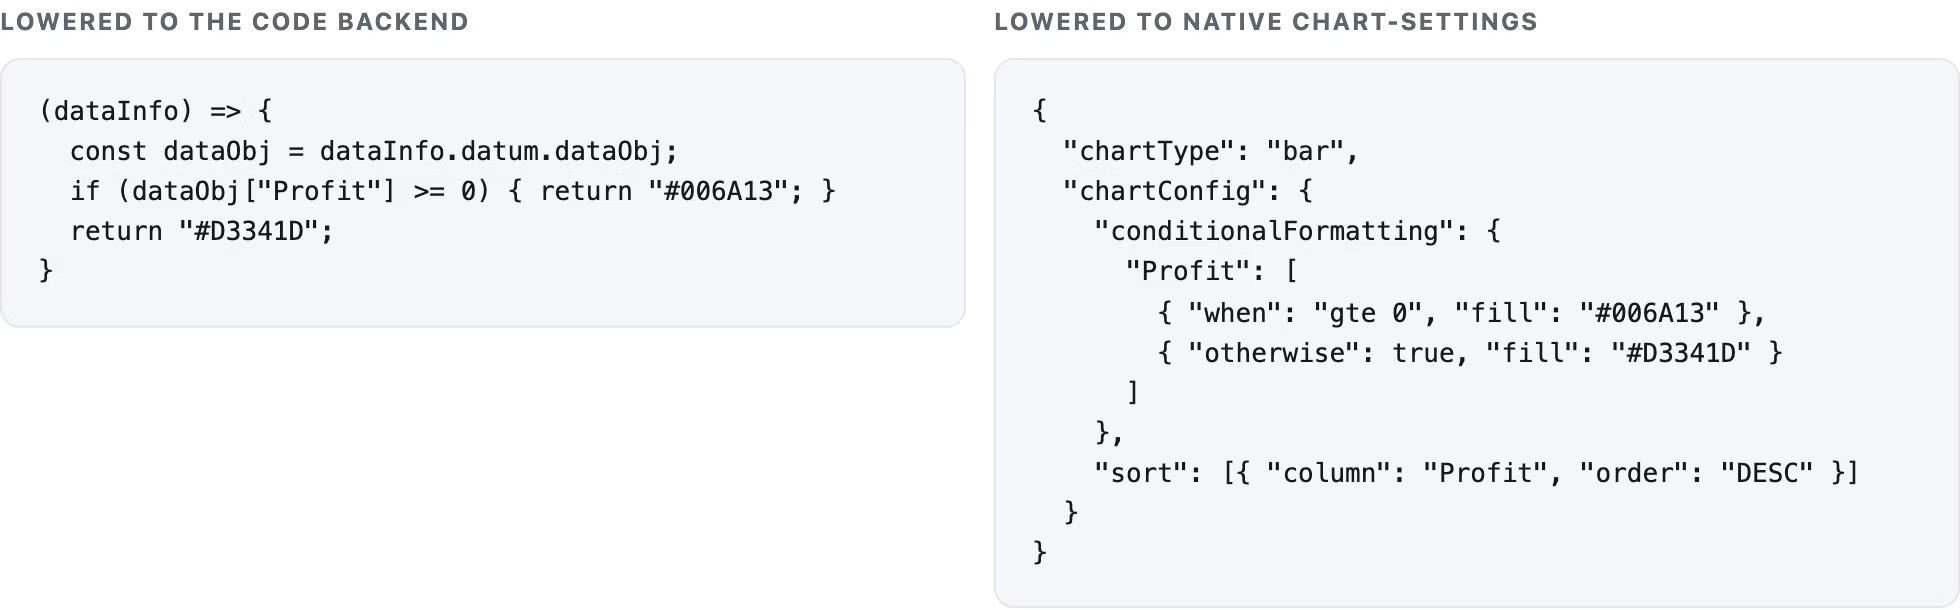
An auto-router picks the cheapest backend that can express a given spec, and the choice is late-bound, per request—because the spec is renderer-independent, the question of which renderer stopped being an architectural commitment. A future backend—another charting library, a server-side renderer, another BI tool's native format—is one new compiler module. The grammar, the model contract, and the conversation semantics don't move.
The code backend is worth one aside: it is a deterministic compiler that builds the output program as a real AST—so malformed programs are unrepresentable, and because it is a pure function, our test suite locks its output byte-for-byte across a large fixture corpus. Where a spec exceeds deterministic coverage, model involvement is scoped to filling explicitly typed gaps, parse-validated before anything ships. The compiler is the code generator; generation is the bounded exception.
Charts are conversations
The first utterance is rarely the last. ChartSpec's third duty is to be the medium of the conversational chart generation, and the design is where several earlier decisions pay off at once.
Charts AI keeps no session state. A follow-up request carries the new utterance and the prior spec; the response is a complete new spec. The spec is not a byproduct of the conversation—it is the conversation's memory, inspectable by the caller, storable anywhere, replayable against any future turn.
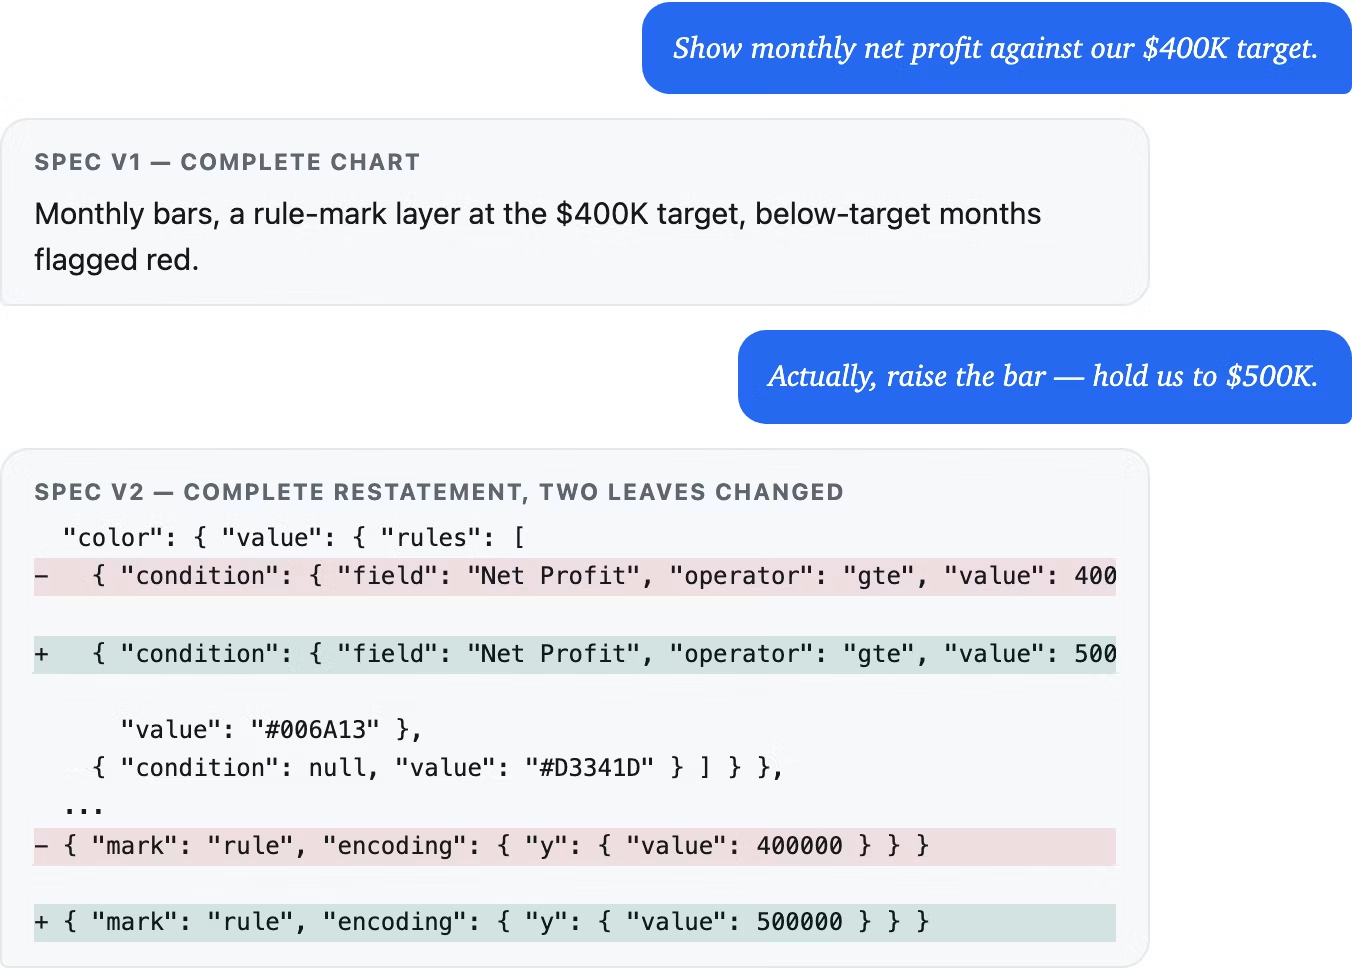
Complete restatement kills the two failure modes that plague delta-based refinement—the model forgetting to carry a setting forward, and the model failing to figure out how to remove something it doesn't understand. And richness carries forward: a user can build a dual-axis melt combo with conditional emphasis and a formula-valued reference line one utterance at a time, because every intermediate state is a complete, first-class spec. The target-line emphasis above survives a switch from bars to an area chart untouched—nothing about it was positional.
Every spec also carries an explanation: a plain-language account of what was understood, including any approximation taken. The transcript of specs is simultaneously a transcript of interpretations.
Where the language goes next
The language is built to grow, and three extensions are already on the roadmap—each a natural next step for the architecture rather than a rewrite.
New coordinate systems
The layout algebra composes Cartesian and radial structure today; geo and network layouts are the next coordinate systems in line. The absorption pattern is already proven: every construct that enters the grammar composes with every channel and transform that exists, so each addition multiplies the expressive range instead of adding one chart type.
Interaction
Brushing, cross-filtering, and drill are coming to the vocabulary, and they will enter it the way everything else did—declaratively. The design work we're most excited about is admitting stateful, event-driven behavior while keeping the complete-restatement conversation model intact, so that interactions become refinable by follow-up exactly the way colors and sorts are today.
A richer value grammar
The formula DSL is growing toward windowed and per-group computations—"average of the trailing four quarters", "share within each region"—under the same data-value discipline: the model names the relationship, the runtime resolves it against live data. The design line we're holding is a value grammar that keeps gaining expressiveness without turning into a query language.
The grammar was the right idea all along. What the LLM era changes is who the grammar is for—and once you take the new author seriously, the language, the compilers, and the conversation model all follow.
Charts AI is now live within ThoughtSpot. Ask Spotter a question in plain English and watch it compose the chart with the power of Charts AI.


