

Business monitoring is essential to a company’s success. Whether you’re improving efficiency, saving costs, planning inventory, or tracking goals, you need to define metrics and monitor them regularly to make progress.
With ThoughtSpot, business monitoring is an intuitive experience that starts with visualizing your KPIs in real-time so you can take action when there’s movement.
Read on to learn about recently launched features to help you stay on top of your KPIs and get to the root cause faster.
Visualize your business metrics with KPI charts
While Headlines (Table Summaries pinned as metrics on Liveboards) were a helpful starting point to visualize a single value aggregated measure on your Liveboards, KPI charts take this to the next level.
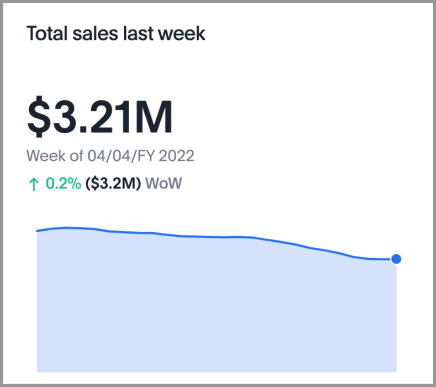
With live KPI charts, you not only can visualize a single value aggregated measure but you can also visualize how that metric is trending and how much it has changed from the previous time period, with a more intuitive user experience.
To learn more on how KPI charts work, check out our online documentation. You can also find more information about upgrading your Headlines to KPI charts in our community.
Track your KPIs and stay informed as they change
Once you have created KPI charts to visualize your key business metrics, the next step is to monitor and stay on top of them. This way you’ll never miss out on important changes to your KPIs which may require immediate attention.
There are two ways to monitor your KPIs in ThoughtSpot, both when you are using the product and when you are away.
KPI watchlist
In addition to pinning your KPIs to Liveboards or saving them as answers, you can add KPIs to your homepage watchlist, giving you an immediate snapshot of your most important metrics every time you open ThoughtSpot.
To set this up, click Add KPIs to your watchlist on the homepage screen and select the Liveboard or answer where your KPIs of interest exist. From there, simply select and add them to your Watchlist.

KPI scheduled alerts
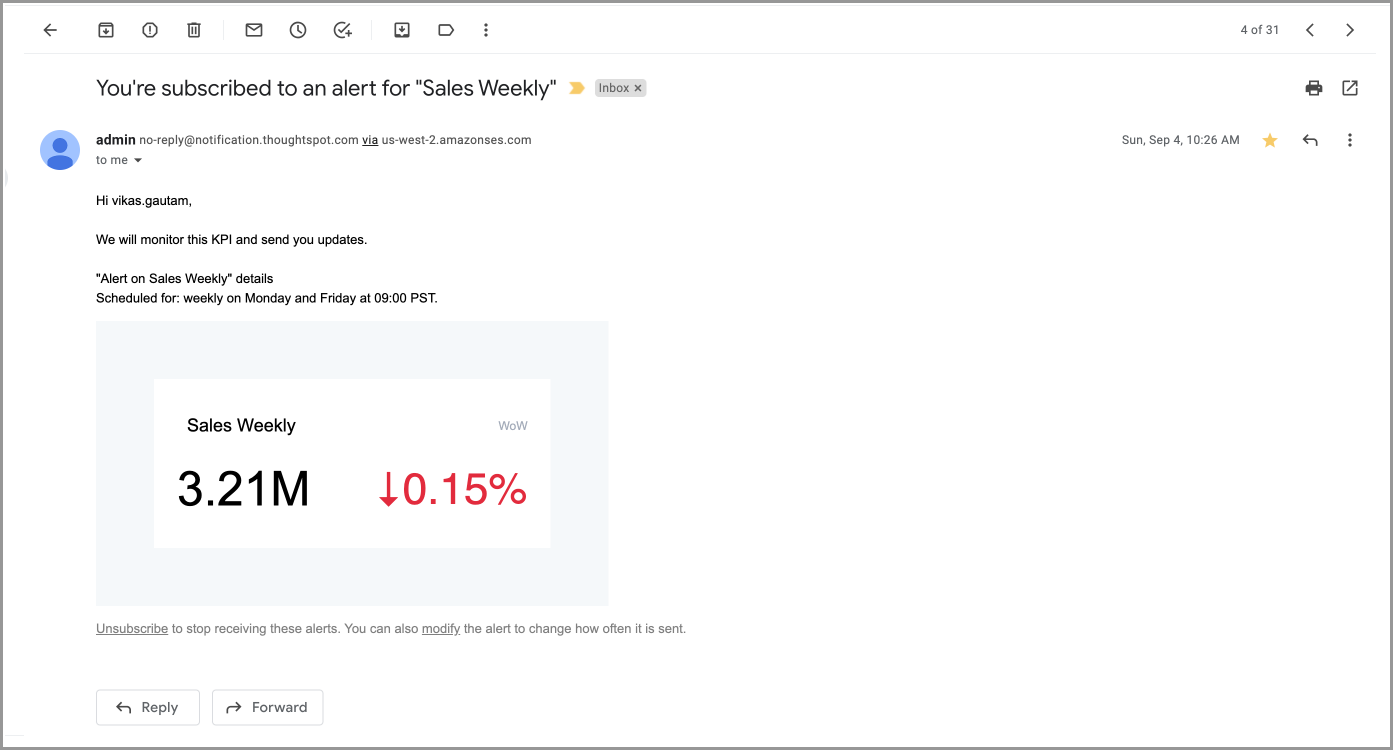
You can also schedule alerts for KPI charts so you never miss a beat on your top metrics even while you are away. These alerts send the latest snapshot of your KPI to your email inbox and can be customized to whatever frequency works for you.
They also include quick access links that direct you to the KPI chart in ThoughtSpot so you can analyze further. Should the need arise, you can also choose to modify or unsubscribe from the email notifications.
KPI threshold alerts
Threshold-based alerts help you cut through the noise and get directly to the metrics that require your attention.
You can create threshold-based alerts to receive notifications when your KPI satisfies a certain condition. For example, create a condition to receive an alert when your Sales KPI becomes greater than a certain number or when it drops by a certain percentage.
Uncover the key drivers behind changes to your KPIs
After you receive a KPI alert, the next step is understanding why the KPI changed. Understanding what caused the changes to your KPIs is often a complex and time-consuming problem for both business users and analysts. This is where SpotIQ’s AI engine for augmented analytics can help.
You can run SpotIQ change analysis for KPI charts to identify key drivers behind changes to your KPI metrics. SpotIQ will automatically drill through the underlying attributes to uncover the most relevant reasons that contributed any changes. To trigger this analysis, simply click on the percentage change on a time-series KPI chart and let SpotIQ do the work for you.
You can register for beta access to this feature by contacting ThoughtSpot Support.
We’ve got lots more in store for KPI monitoring, so stay tuned, or start a free trial of ThoughtSpot to try it for yourself today!


