

Why client facing analytics requires a search-based interface
For decades, the analytics/BI community has suffered from low user adoption (~30%). Dashboards and fancy visualizations have only proven to be the starting point of the analytics journey, not the endpoint. We are living in a world that demands far greater agility than a fixed layer of information or KPI can provide. Poor user adoption is the result when the analytics system fails to support the users full journey: from data – to insight – to action. It’s the need for clients to answer the next question, and the next, and the next; the prolonged interrogation of data is what breaks the dashboard and visualization paradigm. This is one of the reasons that numerous publications, including Gartner, are signaling to the decline and/or death of the dashboard altogether.
The good news is, as of late, we have seen enterprise user adoption of analytics jump dramatically, due impart to the fact that modern business intelligence platforms are enabling a new class of user (what the Harvard Business Review calls frontline workers) with Search and AI capabilities with impressive results. These users are not analytical in the traditional sense. They do not understand tables, columns, rows or SQL statements, but they do know how to shop online and use social media. By creating a UI that blends the best of what our target audience already understands, and blending it with data that is impactful to their jobs, we can flip the analytic paradigm and bring information and power to the people. This analytic engagement of the masses is the force driving transformative change at companies large and small.
As this recent Wall Street Journal article points out, Canadian Tire, one of the largest retailers in Canada, saw retail sales jump 20% higher during Q2 of this year despite the forced closure of ~40% of their retail outlets due to the current COVID-19 pandemic. The key to their success lies in enabling their frontline workers with the information they need to make fact-based decisions in the moment and react to change in real time.

Given well-documented stories of success like Canadian Tire’s, why, when it comes to embedding analytics into our client-facing applications, are we providing the same dashboards and visualizations that history has already proven to be lacking? How are we going to engage and retain more of our clients on your customer-facing application with analytic offerings that have already been proven to have poor adoption. Isn’t the definition of insanity doing the same thing over and over and expecting a different result?
If we are providing analytics to our clients as a value-added offering, whether we are charging for it or not, isn’t the ultimate goal to engage and retain the client? To retain them, don’t we actually have to provide value to the client? In today’s embedded analytic world, we are doing little more than providing our clients with a pretty sign to a dead end street or the equivalent to a “check engine” light on the dashboard of your car.
Think about the last time the check engine light went on in your car. What did you do? Did you panic? Did you make an appointment to have the issue diagnosed? How long did it take to get the appointment? Remember sitting in the lobby of your mechanic or dealership waiting for the results? What was the final diagnosis? Was the overall process/experience of diagnosing the issue positive? Would you even bother to go through the process again if the indicator light came on? Would ever want to subject your clients to this type of punishment?
Yet this is exactly what we are doing every time someone provides their clients with yet another static Dashboard with a couple of KPIs. We are providing a check engine light, with no ability to further diagnose the issues surrounding the indicator or take action as a result of the indicator. If they want to get to the root cause, they have to call your call center, open a service ticket, and wait for a response. This is a productivity killer for both your organization and your client’s. One ticket often leads to more questions and pretty soon the value added service you wanted to provide our clients, has left them feeling unsatisfied with your service, while driving up your support costs.
To provide real insight to our clients, we need to enable a process that allows them to travel the full analytic journey autonomously, from discovery to decision-making. That means we have to re-think the entire user experience. Think about your favorite consumer applications: Google, Netflix, and Amazon just to name a few. They all leverage some form of search that allows its users to autonomously ask questions or look up information.
If we break down what makes these search experiences so simple and easy to use, we quickly notice the following three common elements:
Simple: As we type in the search bar, the application guides us to relevant information in real-time
Fast: When we hit return (to start the search), the application provides us answers, instantly
Smart: The application makes recommendations or suggestions of other relevant content, based on the question we are asking or our previous search history
If we want to make our embedded analytic applications sticky, then we need our analytic applications to follow these proven, yet basic, principles. When successful, the results are seen in your bottom line via improved client satisfaction and/or NPS scores, increased retention of your applications as a whole, all resulting in increased revenues and margins.
Some client examples:
Data Recognition Corporation (DRC) is a leader in educational assessment space. ThoughtSpot is embedded in several of DRC’s offerings, including Beacon. The goal of Beacon is to illuminate student learning needs and measure each individual student’s progress throughout the school year. Beacon allows tens of thousands of grade 3 through 8 educators to target instruction and make informed decisions on proper student actions, all powered by Search and AI capabilities from ThoughtSpot. I would argue few things could be more important in this era of virtual learning.
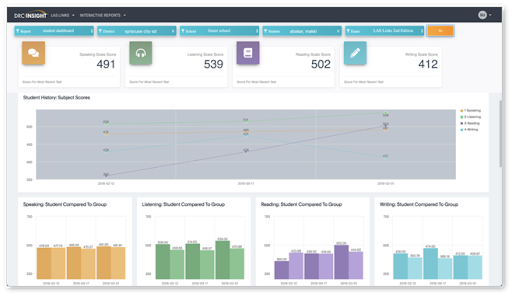
Embedded analytics portal at DRC powered by ThoughtSpot

Mastercard embedded ThoughtSpot as part of their Commercial Payments Intelligence Center (or CPIC) offering. The financial institutions Mastercard works with on a daily basis seek a complete view and understanding of their customers’ card and emerging payment flows. Mastercard’s CPIC empowers the front line business users of these institutions with Search and AI-driven insights, allowing their customers to operate quickly and with greater intelligence than ever before.
Embedded Search and AI not only changes the user experience, but as highlighted in the examples above, it opens up a whole new class of users (front line workers, like teachers at DRC) for your company to target with your offerings. Shockingly, the enablement of these innovations aren’t nearly as hard as you might expect. As more and more of our data is stored in modern cloud data platforms, we open up new opportunities to transform the traditional data and analytics pipeline process. Typically, the team I proudly manage, can prove the search enablement process with a client in about an hour, with their data. In comparison to the data and analytics enablement process we need to build our traditional “check engine” lights and dashboards, it’s down right trivial.
Rigid visualizations and dashboards are dead. Transforming your embedded applications doesn’t have to be hard. By embedding Search and AI from ThoughtSpot, you can increase your applications NPS/user satisfaction scores, create stickier applications that drive higher application engagement, and thus higher retention rates, resulting in high margins and/or revenues for your organization. I encourage you to give it a try. We only need an hour of your time.


