

When a dedicated team was tasked to prepare ThoughtSpot for potential performance bottlenecks that go along with the ever increasing number of deployments in our customer base, we knew we had to start first by measuring the current state we are in if we wanted to effectively reduce those bottlenecks.
Kicking Off with Chrome Developer Tools
Initially, we used Chrome Developer Tools to analyze performance. Although Chrome’s developer tools are incredibly powerful, they lacked some specific functionality for our purposes in two main areas. First, Chrome’s tools only show network calls, preventing us from drilling down as deeply as we’d like into performance. Secondly, these reports cannot be easily automated, meaning time and resources must be deployed to make them effective.

We needed a system that could automate our performance metrics measurement, much like our then integration tests automated our correctness verification process. Not only would this allow us to objectively understand and measure the positive impact our various improvements had on the product, but also provide a check against any regressions that gets introduced. If you’re not measuring the good and the bad, what’s the point?
Using Protractor to Measure Performance
We began with an initial list of basic workflows we knew were critical to customers’ success with the product, and began to immediately measure performance metrics related to these workflows. A workflow in this context is defined as a user interaction or a set of user interactions that the user takes to accomplish a certain task, as well as the application’s response to those interactions.
As we were already using Protractor for defining automated correctness scenarios for our angular based front-end application, it made sense for us to evaluate it for our requirements. The advantages of using Protractor were simple. The performance tests would end up using the same APIs as the end-to-end (E2E) scenarios which in turn would mean writing new tests as well maintaining these tests was relatively straightforward.
Using Protractor had a distinct disadvantage though: selenium commands themselves added latency to the whole workflow. After measuring these latencies, we identified that, though these latencies could reach up to half a second, they were rather precise with a range of a tenth of a second. In other words, running these tests multiple times would lead to a latency within a tenth of a second of the original value. This precision was acceptable in the workflows we had defined.
These tests were different from the usual E2E scenarios. Namely, we needed to stitch some code together which measured the time duration of the test runs. To facilitate this, we wrote a wrapper over the protractor, which not only made time measurements of the tests, but also had a capability of timing certain sub-steps in the tests. Additionally, we wanted these tests to be dataset independent and be able to run these tests on various datasets of various complexities. Dataset was kept as a configurable parameter to the tests, so that once we needed to add a new dataset, we only had to define a configuration file listing metadata specifications the tests required. The wrapper also allowed us to add new functionality later, such as executing multiple runs of the tests and averaging results across them to reduce noise, collection of additional data such as browser memory consumption and frame rate, etc.
Leveraging ThoughtSpot’s Tracing Infrastructure
Automating these crucial workflows and measuring its timing gave us a nice platform where we could attribute any major decrease in these timings to optimizations that we had made in our stack, whereas any major increase in these measured timings pointed out that we had regressed somewhere in our stack. To identify where exactly that optimization or regression has been made was our next challenge. That is where ThoughtSpot tracing infrastructure came in.
The idea behind our tracing infrastructure was simple. Whenever one component had a task it that consisted of several subtasks, it could create a trace object for the duration of the task, and with the subtasks also creating such traces, string the subtask traces as the children of the task trace, thus identifying how much which subtask contributed to the task duration. This nesting could go arbitrarily deep as well as measure durations across services.
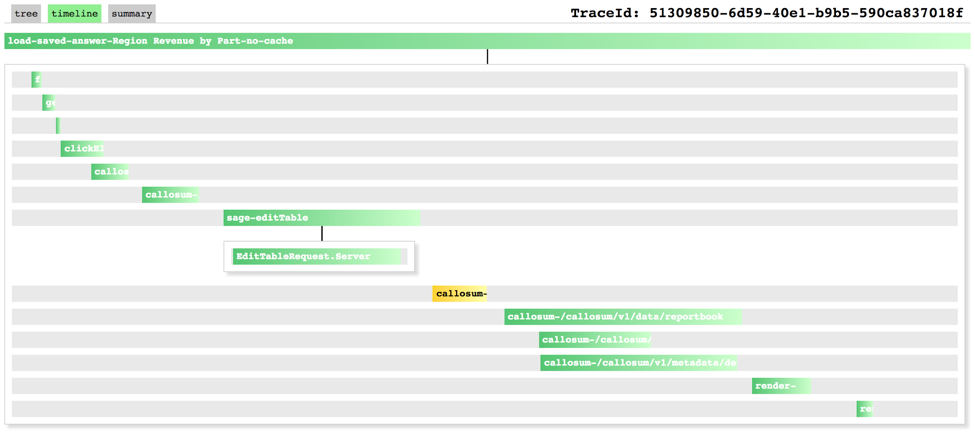
For example, we created a trace for the duration of the automated workflow. The various network calls made to the metadata service had their own traces, which were children of the workflow trace. In turn, metadata service could create its own traces for various actions it performed and RPC calls it made to other services. All these traces could be visually analyzed by trace viewer utility to narrow down where exactly we had regressed.
Turning Insight into Action
Once we had the basic implementation of what and how we were going to measure performance bottlenecks, the next job was to setup a pipeline where we could run these tests across various scenarios. We set up jobs on Jenkins CI which ran these tests at regular intervals on different datasets. Also, the metrics generated by these jobs were fed into internal ThoughtSpot instances for better visibility and analysis.
Using ThoughtSpot, we were able to create dashboards that gave us a bird’s eye view of these performance metrics on a daily basis. Additionally, by defining bounds on our metrics we were able to set up alerting on slack whenever these metrics deviated from the defined bounds, calling us into action for digging further into them.
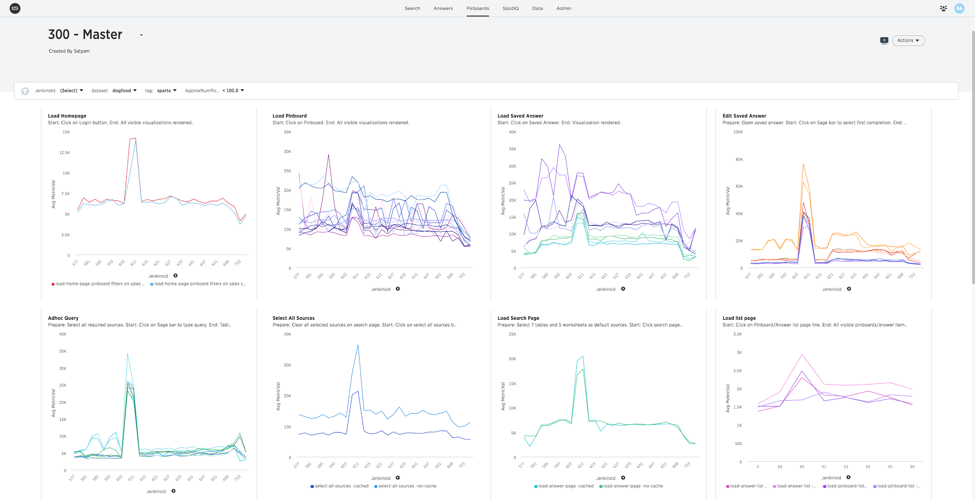
This pipeline has given us enough capability to measure, monitor, and analyze the effects of the changes we are making. By adhering to a strict regime of measurement, we have been already been able to identify and begin to fix many of the bottlenecks as well catch a few major regressions which may have gone unnoticed otherwise.


