

Everyone in marketing has heard something like this before:
Half of the money I spend on marketing* is effective. The trouble is I just don’t know which half.”
We’ve come a long way since US department store clerk John Wanamaker first made this comment in the 1920s. Yet despite the fact that marketers are now swimming in a sea of marketing analytics data about their campaigns, content, and pipeline, we still struggle to answer that same question. Just collecting the data from all of our marketing activities in one place can be a challenge. Then once you finally have it, how do you make sense of it all without a data science degree or months of SQL training?
Most of us have resigned ourselves to waiting for monthly or weekly report updates from the company reporting tool and, if we're lucky, we have an overworked BI analyst who can help us make changes within a few days or weeks. What we need is direct access to that data so we can ask our the questions ourselves, without waiting for a trained middleman (or woman), who doesn’t understand the business the way we do, to do it for us.
Below I’ve outlined the top 5 questions that every marketer should be able to ask their data on a daily basis, and how to answer them.
1. What does my lead flow look like?

Let’s start with something relatively simple: lead flow. As marketers, we live and die by the number of leads that come in every day. Tracking leads by channel and by quality is imperative if you want to bring the most value to the company. The first thing you should look at is what is weekly lead flow by channel. Once you understand this, you can start to dial up your focus on different channels, or try different messaging to improve your lead flow across all of your channels.
2. How are my leads converting down the line?
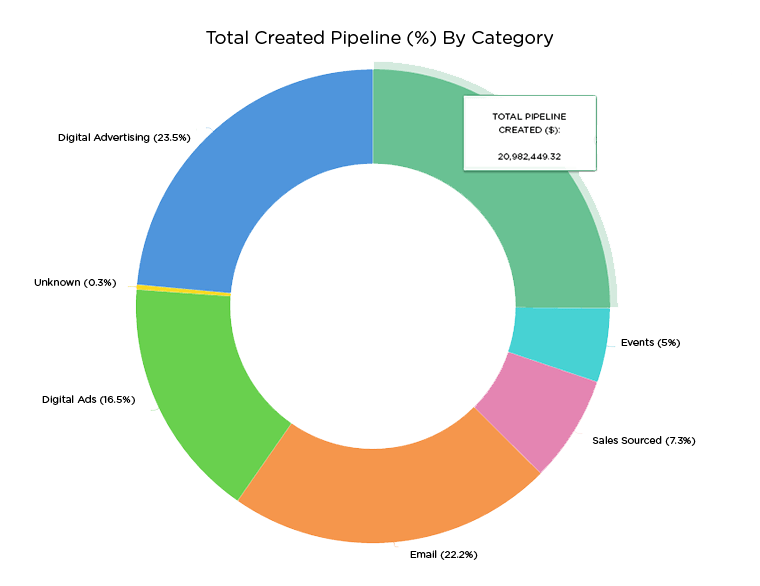
Now that you have a picture of your lead flow, you want to investigate how those leads are converting to pipeline across your different channels. Your website may be a huge driver of traffic, but is that traffic worth anything? Maybe events are a better investment for your company. You also want to be able to look at this both from an all-time perspective as well as a monthly perspective, especially if seasonality affects your business.
3. Which content works best on each channel?

As marketers, we produce a lot of content. Testing the effectiveness of these campaigns in terms of leads and pipeline is another important piece of the puzzle, one that gets even more interesting when you layer in the channel data from Question 1. You should be able to easily identify your top performing campaigns and top performing channels. So maybe your e-book is a top driver on LinkedIn, but your infographic is more popular on Facebook. Understanding this granularity of data is a key insight for any marketing leader.
4. Where in the funnel am I getting stuck?

It’s not all about the leads, though. Pipeline and conversion rates are equally as important. Understanding your pipeline velocity and where in the funnel you are getting stuck can make or break your quarter. What's the average length of time that opportunities sit at each stage?
5. Where is my traffic coming from?
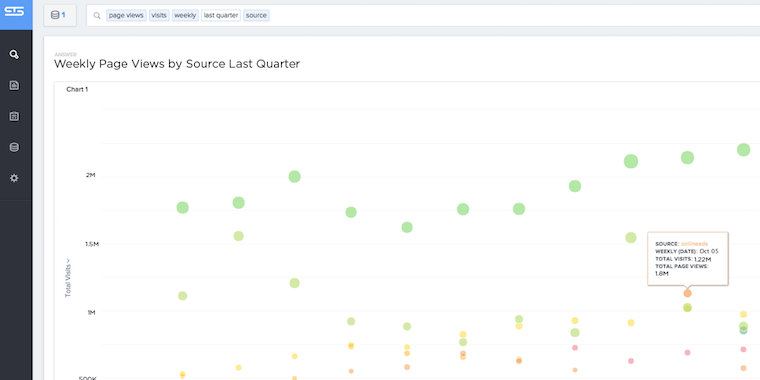
Finally, once you understand which channels are performing well and which are not, you need to be able to dive into the marketing analytics data to understand how you can improve those numbers. Take the website, for instance. We know that’s a top driver of leads and pipeline. But how are people getting to our website, and what can we do to drive more of them? What are the top drivers of traffic to my website?
6. Why?
I’m going to throw in one extra question for everyone who has made it to the end of this post. So far, our questions have been fact-based and single answer. But the data starts to get really interesting when we introduce follow-up questions aimed at understanding the “why.” It’s one of the key benefits of doing your own analysis in real-time. Once you get your first answer - maybe that your e-book performs best on LinkedIn - the next question is, why this is the case? Is it the layout of the page, or is it the form they need to fill out? Is it the copy on the ad or the type of person coming to the site? Drilling down to this level of granularity will let you more fully understand what’s happening and help you figure out how you can improve over time.
A lot of people assume marketing is just subjective, creative work. And some of it is. There’s an art to crafting the perfect campaign, and to writing copy that sticks with people. But now more than ever before, we have the opportunity to supplement our creativity and drive it in the right direction by understanding the data available to us. The best analytics technologies should bring easy data access and analysis to everyone, particularly to (traditionally) non-technical roles or departments that have never been able to fully tap into these insights.
Stay tuned for a similar series on what sales executives, finance professionals, and HR managers should ask their data.
*The original quote referred to “advertising,” but the same idea applies.


